ETF Trading Research 4/24/2017
Today’s Trades – Current Trades (Non-Green – Bought/Sold/Hold) – Those highlighted in Yellow we are still long.
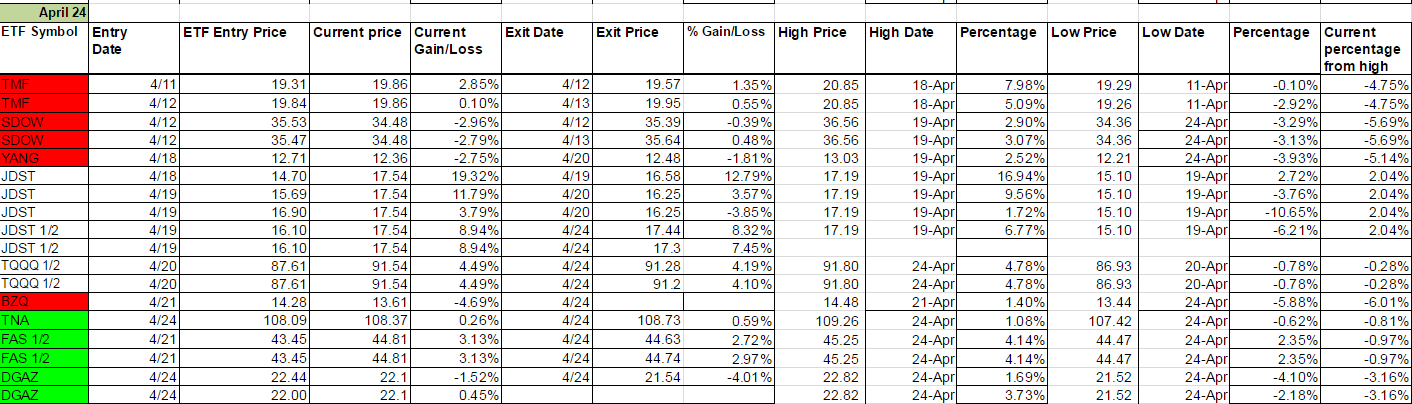
We managed to lock in some good profit today with JDST leading the way at 8.32% on 1/2 shares and 7.45% on the remaining half shares. Should have just scalped UWT early when the profit was there. DGAZ gave us fits after a quick move up but I like the chart. Nat Gas, like oil, is always a risk in that news can come out and change the game but that Nat Gas move was just traders doing what they do. I sent out a chart in the alert to show it was normal, but we’ll look to get a continuation of the newly established trend. We took the profit on TQQQ of over 3% and FAS almost 3%. TMV was all over the place today and we tried it once but stopped out -0.76%. TNA was a late buy and got us about a half percent. All in all a good day. I did get conservative as the day went on and futures really didn’t move much higher nor did the DOW. Tomorrow we may catch a run short as we move into Wednesday’s government shutdown possibility with the Democrats battling Donald Trumps wall with Mexico. I prefer to scalp until then and maybe catch a run in JNUG to go along with our DGAZ trade.
Of the trades we got out of that were green on the weekly, JDST did move higher, DSLV, DGLD lower. TQQQ and FAS higher and TNA lower. The good news is we profited on all of them and flat on DSLV.
Economic Data For Tomorrow
Tomorrow we have Consumer Confidence and New Home Sales as the major market moving data at 10:00 so we will be able to trade off of that. It might make sense if you are conservative to be out with profit any ETFs before the data or wait for the data before you choose sides. While I do expect a little pullback, if the data comes in better than expected it can get me a little bullish, but we have potential other failures with this week if Donald Trump doesn’t follow through on his Tweet. President Trump may be learning that if you make promises in public like this, the Democrats can wreak havoc into your presuppositions of tax reform and reduction. That wouldn’t be good for the markets.


http://www.investing.com/economic-calendar/
Stock Market
We fell short of a record breaking Nasdaq 6,000 but we did get a little more profit out of TQQQ. But end of day futures gave up a little bit and I think it it smart money selling. Futures couldn’t get past 2723 and closed 2370.25 but after hours is already down to 2368.50 but then bounced back up after some earnings releases to 2370.25.
My job is to lock in profit. The more this service does this the more you’ll be happy as subscribers. My job is also to keep stops and I don’t like having to take 4% stops like we did in DGAZ today by just a small fraction. I usually have the stops wide enough to not get whipsawed out but have learned to get back in and because it is a green ETF have a little more confidence in the trade. Even then we have to keep stops. Part of me just wanted to scalp the DGAZ for 28 cents but that chart looks too good.
Foreign Markets
Ignored the foreign markets today as there is no real trend here.
Interest Rates
TMV gapped up nicely and wish we didn’t sell Friday in a moment of weakness. Would have sold some of that gap up this morning. Right now with the volatiltiy neutral.
Energy
Didn’t call the sell for profit in the morning on UWT. DWT may just show us some move but We are at the point where UWT may just bounce. I would buy whichever one is up tomorrow and look to scalp it only.
Precious Metals and Mining Stocks
Well, the French election first round is over and the dollar moved down with gold. Will the dollar now recover and push gold lower? Maybe. I wanted to be flat right now and see how this plays out. We locked in profit and I don’t like giving it back. Did you notice that last little move up in JDST right at the close was not supported by DGLD and DSLV?
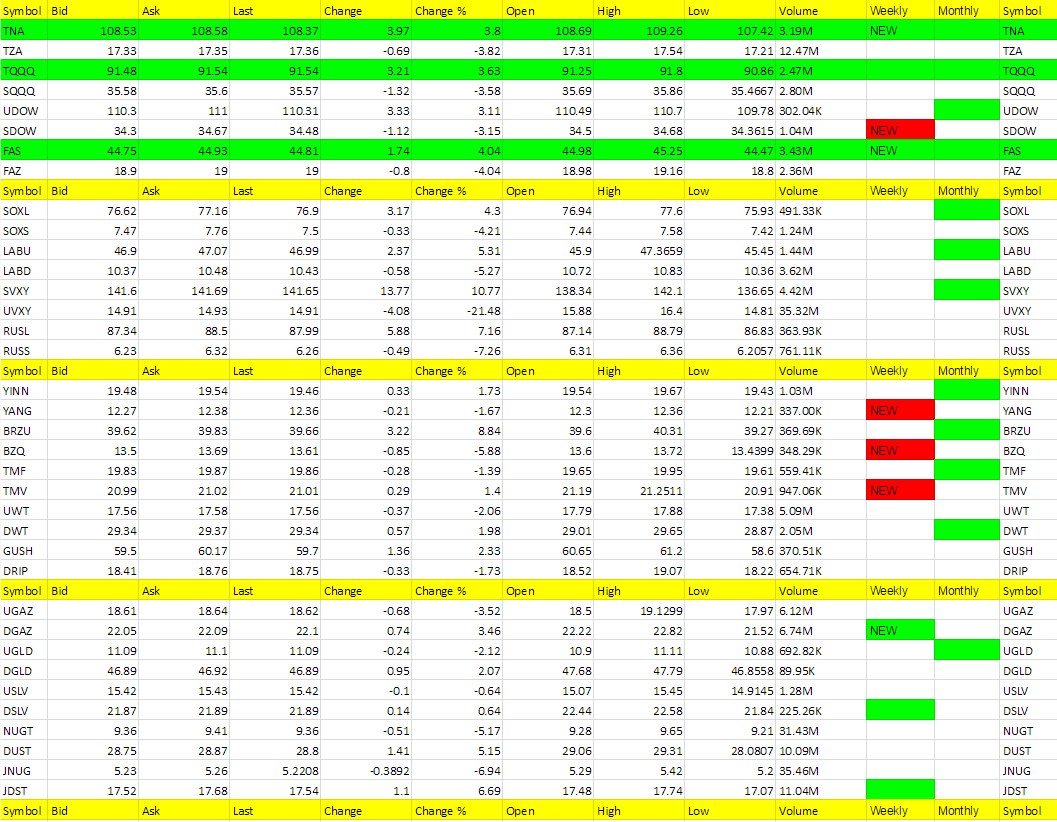
Hot Corner (the biggest movers – 3% or more – or new ETFs that are green on the weekly – those in bold are consecutive days in the Hot Corner):
SVXY, BRZU, RUSL, JDST, LABU, DUST, SOXL, FAS, TNA, TQQQ, DGAZ, UDOW, (TNA, FAS and DGAZ turned green on the weekly)
Cold Corner (the biggest moved lower 3% or more that are green on the weekly and or weekly/monthly or turned red on the weekly – those in bold are consecutive days in the Cold Corner):
UVXY, RUSS, JNUG, BZQ, LABD, SOXS, NUGT, FAZ, TZA, UGAZ, SQQQ, SDOW. (SDOW, BZQ. YANG and TMV turned red on the weekly)
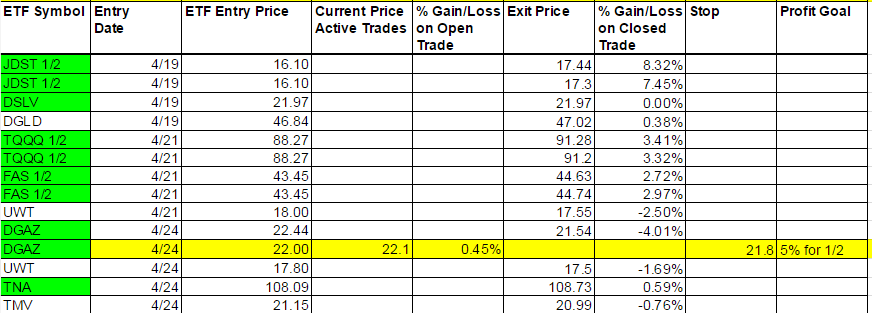
Green Weekly’s
These are the ETFs that have turned green on the weekly and the dates they turned green. This is used for tracking your percentage gains so you know when to take profit for each ETF per the Trading Rules profit taking guidelines. It is also used for tracking the percentage from high to keep a stop on remaining shares. These green weekly’s work as you can see from the %Gain/Loss tables. You won’t get the exact high with your trade but you will also be out before typically well before they start to fall again. Your best way to profit with the service is stick with the green weekly trend and take profit while using a trailing stop on remaining shares. Also, if these green ETFs are up for the day at the open, they offer the best scalping opportunities too. I am always fine tuning this section so if there is confusion at all, email me and be specific and I’ll be happy address.
I know I have said this many times but it is worth repeating; If you stick with the green weekly trades your odds of profit increase as there is more risk with the day trades. I call the day trades with the intent of catching some runners, so will get a few 1% stop outs but eventually catch the 5% to 10% or more runners. The important part of the list below is that the longer the ETF stays on the list (the one’s at the top of the list by Entry Date) the more likely it is to turn red on the weekly and the opposite ETF comes into play as a long. You’ll notice in the last column on the right it says “Current percentage from high.” This is your normal stop out for any ETF where I don’t specifically call it per the Trading Rules which lists the trailing stops for each ETF. It is a Trailing Stop percentage from the high and I have noticed the pattern that the closer it gets to 5% the sooner the ETF turns red on the weekly.