ETF Trading Research 10/9/2017
For those of you new here, I most of the time have the ETF Trading Research report out by 8PM PDT, and it comes by an RSS feed, but you can look at the report here sometimes before you get it in your mailbox; https://illusionsofwealth.com/category/etf-blogs/ This is also the same link if there are any technical difficulties.
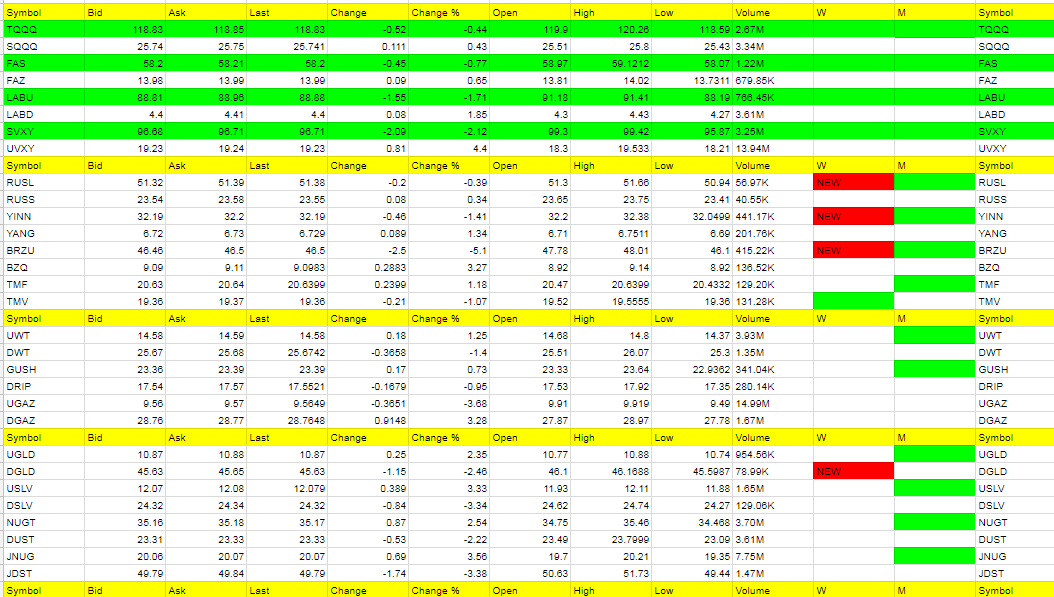
Today’s Trades and Current Positions (highlighted in yellow):
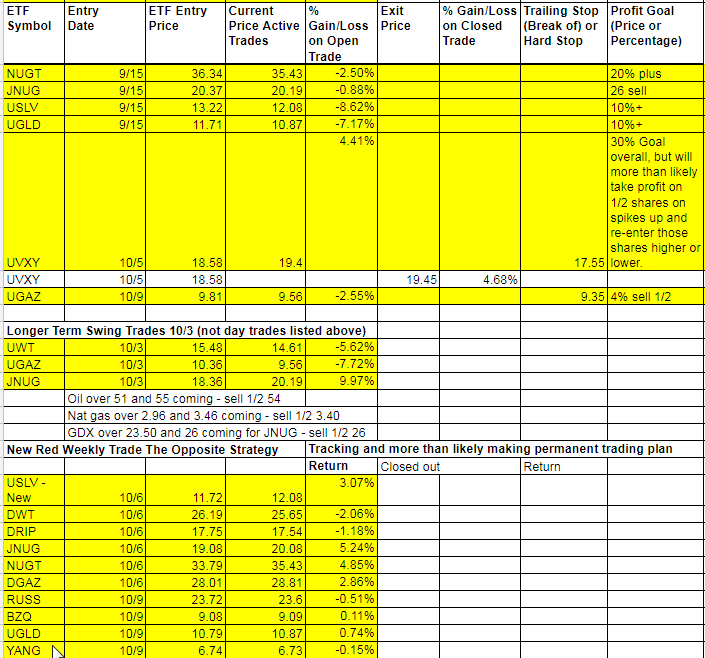
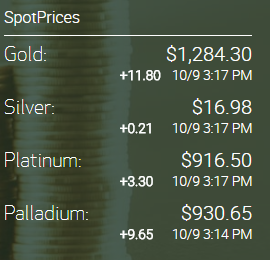
Great day for metals, miners and UVXY. We took off 1/2 shares for 4.68% or better on half of UVXY. Holding metals and miners which have come back nicely for us.
Economic Data For Tomorrow
No real market moving data tomorrow but 2 Fed members speaking and FOMC minutes release coming on Wednesday. Still expect some volatility.
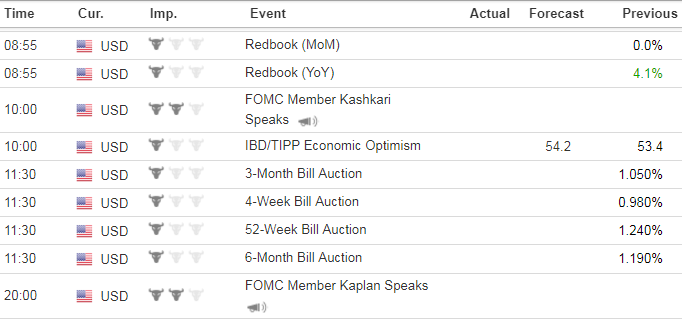
http://www.investing.com/economic-calendar/
Precious Metals and Mining Stocks
Nice little move in metals and miners today. The closer we get to 1300 and 17.50 in gold and silver, the more we should think about putting in those tighter stops. USD/JPY tried to break lower but stopped just south of 112.60. GDX resistance is 24 and we got to 23.82 and GDXJ 35 which was hit today.
Repeating what I wrote yesterday below.
Metals and miners should continue the mini-bull run up for now, and we’ll put in some trailing stops at this point as I don’t want to ride these down again, should we fall. Here’st the scenario;
- USD/JPY falls it’s stay the course and remain in metals and miners. We need to keep hitting lower lows. Simple as that with this being our number one indicator. Support is 112, 111 next.
- GDX closed over 23.50 which is one of the targets we had. You can use this as your stop should we continue higher on Monday and Tuesday and then have a pullback. 23.62 was the last print. 24 is a resistance level to hit first, then 24.50/60. Prior high was 25.60.
- COT Data for gold and silver wasn’t exactly bullish overall.
- Miners are leading metals and silver leading gold. We have to watch the 1300 level and 17.50 for gold and silver now and see if we can break those. Otherwise, one more test of the lows, which of course not what we want, but the possibility is there. That means that last blow off bottom in metals to the 1240/50 level and USD/JPY to 114.50. It’s the only scenario where I am looking at keeping a stop this time. The confusing part is my longer term trades from 10/3. We are up 5.56^ on the JNUG side of it and a move higher would probably have me lock in some profit. My goal was to wait till the end of the month on these, so any “noise” between now and then, we would have to deal with. But if we did turn green on the weekly, it allows us to then apply the Trading Rules profit objectives above and beyond where we might be at that time. Worth holding out for that potential. I’m trying to improve the Trading Service to not allow what happened with the metals and miners again and even though I had listed in the Trading Rules to sell any ETF that went red on the weekly, I want to on a daily basis stick with this and also take that other side. If you think about it, if we switched to JDST, we would have been rolling in it with profit. I have corrected this weakness and those of you who have stuck around through the trials and tribulations of some of these moves, I appreciate it and my goal is nothing but profit for us all.
Monday Afternoon Price
Sunday Afternoon price

Hot Corner (the biggest movers – 3% or more – or new ETFs that are green on the weekly – those in bold are consecutive days in the Hot Corner):
UVXY, DGAZ, JNUG, USLV, BZQ
Cold Corner (the biggest move lower 3% or more that are green on the weekly and or weekly/monthly or turned red on the weekly – those in bold are consecutive days in the Cold Corner):
BRZU, UGAZ, DSLV, (new red weekly in DGLD, BRZU, RUSL and YINN)
Green Weekly’s
These are the ETFs that have turned green on the weekly and the dates they turned green. This is used for tracking your percentage gains so you know when to take profit for each ETF per the Trading Rules profit taking guidelines. These green weekly’s work as you can see from the %Gain/Loss tables. You won’t get the exact high with your trade but you will also be out typically well before they start to fall again or turn red on the weekly. Your best way to profit with the service is stick with the green weekly trend and take profit while using a trailing stop on remaining shares. Also, if these green ETFs are up for the day at the open, they offer the best scalping opportunities. I am always fine tuning this section so if there is confusion at all, email me and be specific and I’ll be happy address.
I know I have said this many times but it is worth repeating; If you stick with the green weekly trades your odds of profit increase as there is more risk with the day trades. I call the day trades with the intent of catching some runners, so will get a few 1% stop outs but eventually catch the 5% to 10% or more runners. The important part of the list below is that the longer the ETF stays on the list (the one’s at the top of the list by Entry Date) the more likely it is to turn red on the weekly and the opposite ETF comes into play as a long.
Sell half shares on a spike up on any ETF you are long, even if goal is higher. Spikes higher are almost always followed by moves in the opposite direction. Try and get out with a market order quickly before the quick move back lower. Lock in that profit!