ETF Trading Research 11/12/2017
For those of you new here, I most of the time have the ETF Trading Research report out by 8PM PDT, and it comes by an RSS feed, but you can look at the report here sometimes before you get it in your mailbox; https://illusionsofwealth.com/category/etf-blogs/ This is also the same link if there are any technical difficulties.
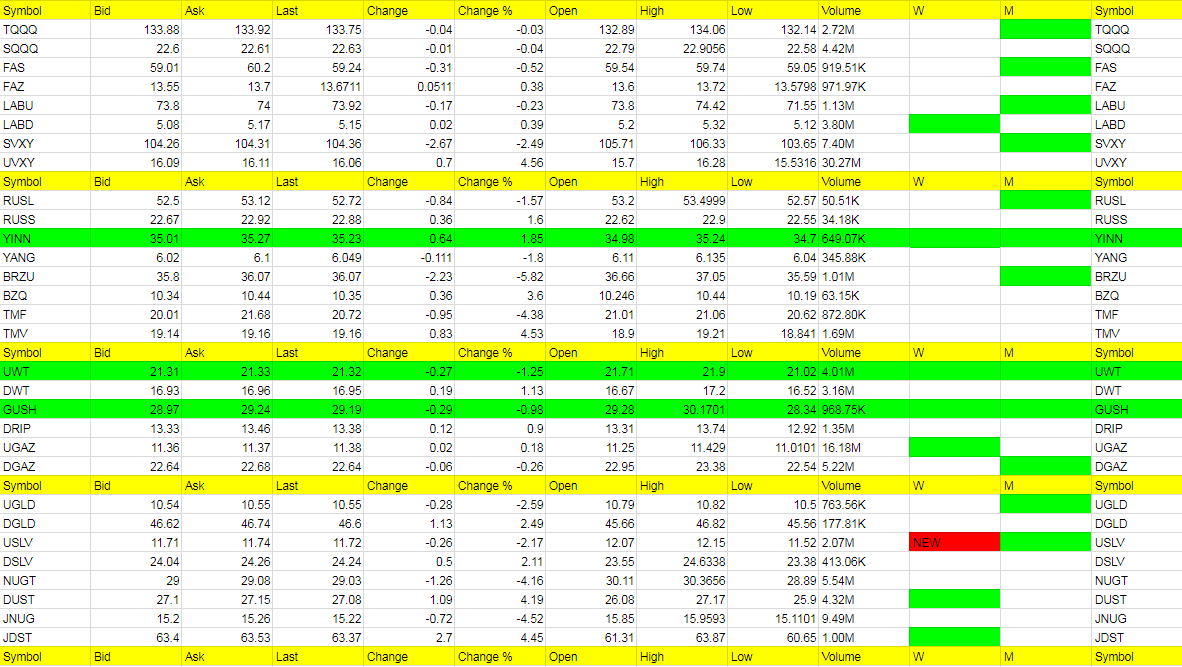
Today’s Trades and Current Positions (highlighted in yellow):
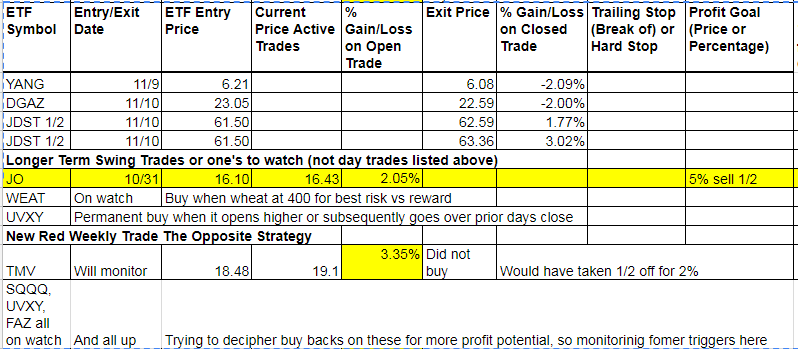
We did ok with JDST and I think we will again on Monday and beyond for now. TMV we may get back into as well. YANG and DGAZ didn’t work out but DGAZ I like on Monday as well as we are already down 3 cents in nat gas. See below for more on all.
Economic Data For Tomorrow
No big data tomorrow.
http://www.investing.com/economic-calendar/
TECHNICALS
Daily
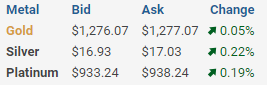
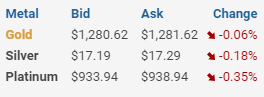
- RSI continues to trend higher despite today’s drop to 46 but both the MACDs turned down on the back of the $4bln smackdown today.
- Competing divergences with the latest negative divergences pointing south. Crucial battle going on here between paper shorts and strong physical demand it appears.
- Resistance at 1289. Support at the 200 day MA currently at 1263.
Weekly
- Trendline support is at 1250 now.
- Below there, the next trendline support is the former resistance trendline at 1240.
- Below there and the last major trendline support is at 1204.
Monthly: Contrary to what many others I see trendline support, former resistance, at 1240 currently. Below there, the weekly support trendline at 1204 also shows up on the monthly chart.
FIBONACCI LEVELS
- 1250-53: 1250 is 38.2% of 1377-1045. 1251 is 50% of 1377-1124. 1253 is 76.4% of 1923-1045.
- 1241-43: 1241 is 76.4% of 1204-1362. 1243 is 50% of 1124-1362.
- 1211-21: 1211 is 50% of 1045-1377. 1215 is 61.8% of 1124-1362. 1221 is 61.8% of 1124-1377.
POSITIONING
- While not excessive, Funds’ net long position remains elevated, as does open interest.
- To be confident of a bottom worthy condition, we need to see Funds’ long positions cut to <150k, preferably <100K, ideally <50k, and open interest <500k.
- There was no new COT data today due to Veteran’s Day but open interest had increased to 534k as Thurs close.
- This is one of the primary reasons why I do not believe we have seen the bottom in Gold yet.
SENTIMENT
- The second principal reason is that DSI bottomed at 23 on Oct 5th when price hit a low of 1262. I never felt that this was low enough for a true bottom to be in place. All of the previous major troughs were associated with a DSI in the teens or single digits.
- The DSI has been unable to break 50 since, rising as high as 47, and is now back to 36 and falling. I expect price to fall further until the DSI is <20.
INTER-MARKET ANALYSIS
USD/JPY
- Despite being overbought and falling, USD/JPY has remained in a range of 113-114.73, more or less sideways. The MACDs have room to fall further but the RSI is back to a neutral 50 level. This means that price could go either way from here and when an asset is overbought but fails to fall meaningfully, that is typically bullish. Should this play out, it supports a lower low in Gold.
USD/CNY
- Gold has also been following the Chinese Yuan recently and this also explains the drop from the 1362 high. However, USD/CNY is now in a sideways wedge and which way it breaks will help determine the next direction for Gold.
DXY
- Gold has also been tracking the DXY somewhat lately, although not pip for pip on a daily basis. The dollar index ran out of steam at 95 and has fallen back to trendline support. If this breaks, I am looking for a bounce from 93 or its 50 day MA at ~93.20, which may weigh on Gold ST.
TIPS
- Now this IS a primary driver of Gold prices, or at least it was until a big divergence developed between the two since Oct 27th. Either Gold had to rise or TIPS had to fall. My guess was the latter given that TIPS were overbought and heading into massive FIB resistance at 114.43/45, and that is exactly what is happening. TIPS have fallen rapidly back to 113.71 and I expect that to continue, perhaps as far as 112 before going higher again.
TLT
- The fall in TIPS is not being driven by rising inflation expectations so much as the spike in Bond yields recently. TLT maxed out at 126.80 again, its peak of Sept 25th, and is now dropping like a lead balloon, like TIPS. I don’t see this stopping until at 123, possibly the prior low at 122.15, or even lower.
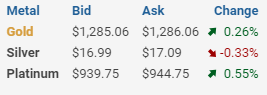
Thursday Afternoon Price
Wednesday Afternoon Price
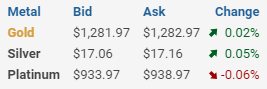
Tuesday Afternoon Price
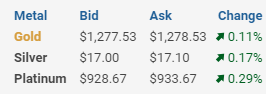
Monday Night Price
WEEKLY REPORT – COFFEE
SUMMARY
- Technicals, positioning, and sentiment all suggest the low is now behind us and a new uptrend has been established. Next big resistance is 1.327 with support at 1.23.
TECHNICALS
Daily
- Highest close since Oct 11th. Also highest intraday peak of 1.2840 since Oct 11th. Trend appears to have changed to the upside.
- Never closed below 1.23 support. Intraday low of 1.212. So huge support at 1.23 on a closing basis.
- RSI & MACDs are all trending higher. With the RSI at 53, there is plenty of room to move higher.
- Resistance is between 1.279-1.283.
Weekly
- Trendline support since Nov 2013 at 1.24 has held again.
- Now the RSI and MACDs are turning up too. Bullish off strong support.
Monthly
- It still remains to be seen if we’re heading into a wave (iii) of 3 of III but we could be. A break of 1.17 would be required to negate this possibility.
POSITIONING
- As of Oct 31st, Funds had tapered their net short position for the first time in 4 weeks from a record level.
- Funds had also raced to get short over the prior 8 weeks but at a positively divergent rate compared to prior periods of rapid short accumulation.
- Point being, this looked like the bottom in shorting by the Funds with a lot of fuel for an upside rally. Is that what we’re seeing now?
SENTIMENT
- Spot DSI bottomed in Oct at a higher low than in April and May, and has since been setting higher lows and higher highs, basically trending higher, much like price.
- This can be seen clearly on the 21 day moving average chart and bodes well going forward.
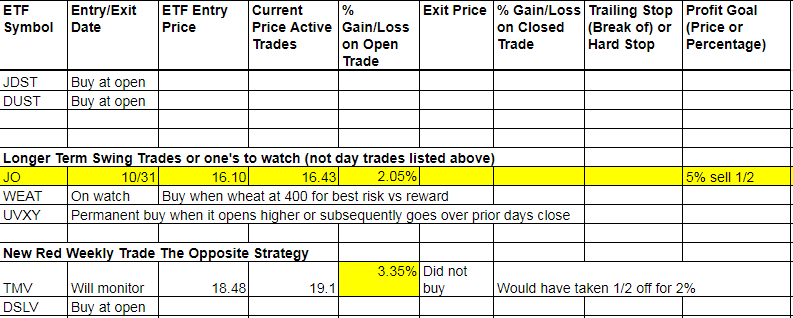
JDST, TMV, UVXY, BZQ, DUST (JDST and DUST new green weekly)
Cold Corner (the biggest move lower 3% or more that are green on the weekly and or weekly/monthly or turned red on the weekly – those in bold are consecutive days in the Cold Corner):
BRZU, TMF, JNUG, NUGT (USLV new red weekly’s)
Green Weekly’s
These are the ETFs that have turned green on the weekly and the dates they turned green. This is used for tracking your percentage gains so you know when to take profit for each ETF per the Trading Rules profit taking guidelines. These green weekly’s work as you can see from the %Gain/Loss tables. You won’t get the exact high with your trade but you will also be out typically well before they start to fall again or turn red on the weekly. Your best way to profit with the service is stick with the green weekly trend and take profit while using a trailing stop on remaining shares. Also, if these green ETFs are up for the day at the open, they offer the best scalping opportunities. I am always fine tuning this section so if there is confusion at all, email me and be specific and I’ll be happy address.
I know I have said this many times but it is worth repeating; If you stick with the green weekly trades your odds of profit increase as there is more risk with the day trades. I call the day trades with the intent of catching some runners, so will get a few 1% stop outs but eventually catch the 5% to 10% or more runners. The important part of the list below is that the longer the ETF stays on the list (the one’s at the top of the list by Entry Date) the more likely it is to turn red on the weekly and the opposite ETF comes into play as a long.
Sell half shares on a spike up on any ETF you are long, even if goal is higher. Spikes higher are almost always followed by moves in the opposite direction. Try and get out with a market order quickly before the quick move back lower. Lock in that profit!