ETF Trading Research 11/8/2017
For those of you new here, I most of the time have the ETF Trading Research report out by 8PM PDT, and it comes by an RSS feed, but you can look at the report here sometimes before you get it in your mailbox; https://illusionsofwealth.com/category/etf-blogs/ This is also the same link if there are any technical difficulties.
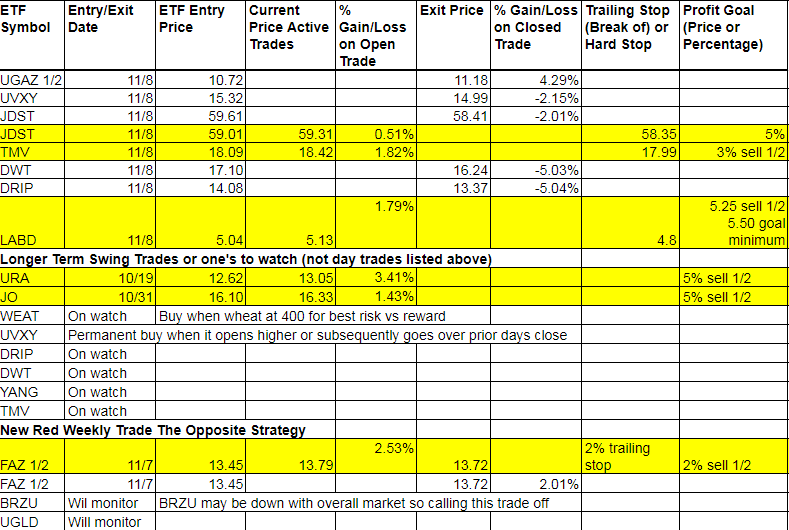
Today’s Trades and Current Positions (highlighted in yellow):
Tough day for DWT and DRIP on that market maker move. See below for more. UGAZ was up over 3% for us and came back a little. URA is flat now and poised. JO positive and poised. TMV new entry is up and JDST is up on the second attempt. Should have an easier go at it tomorrow, but let’s be careful with some whipsaw in UGAZ after the Nat Gas report. I will say this about it, Nat Gas is heading up either way. Don’t get whipsawed.
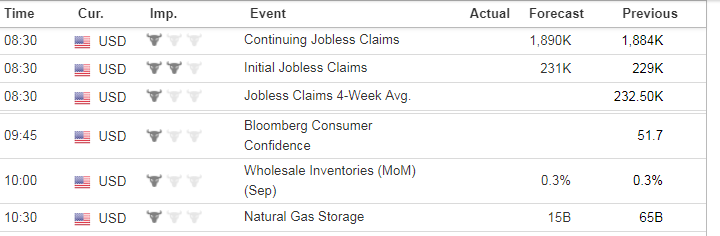
Economic Data For Tomorrow
Tomorrow’s important data is Initial Jobless Claims and Nat Gas Storage 10:30 EDT.
http://www.investing.com/economic-calendar/
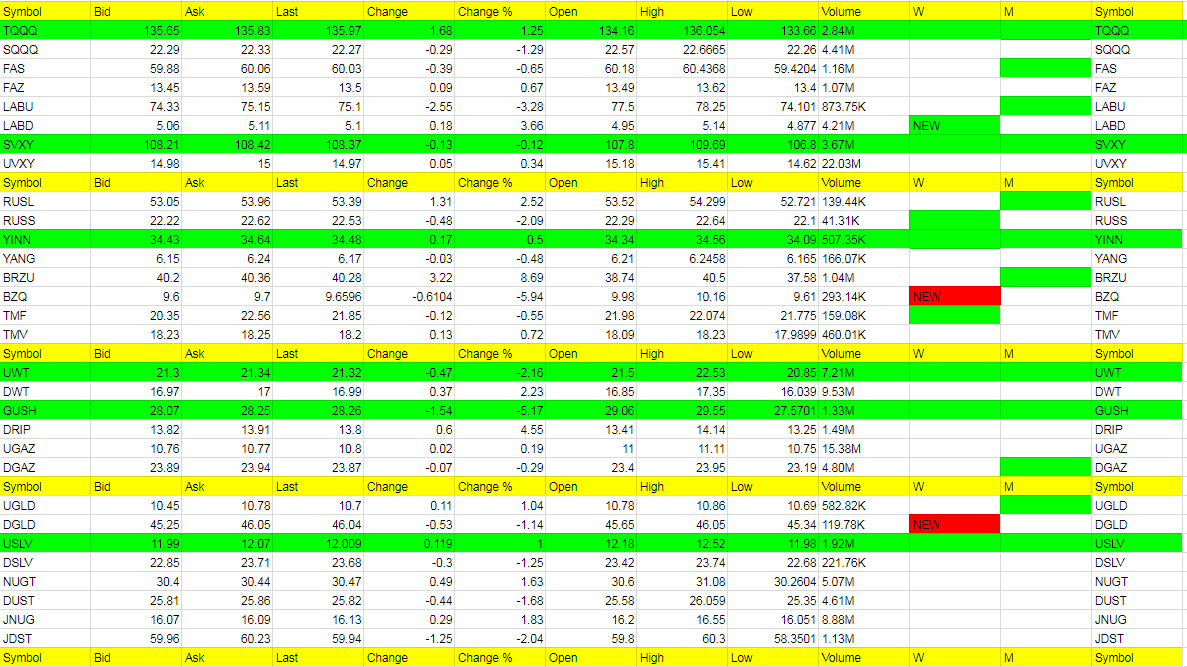
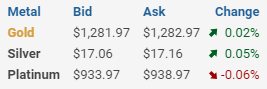
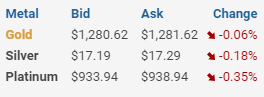
Wednesday Afternoon Price
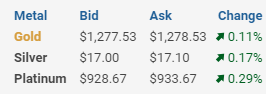
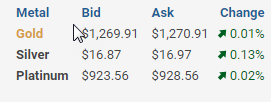
Tuesday Afternoon Price
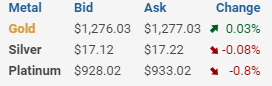
Monday Night Price

Hot Corner (the biggest movers – 3% or more – or new ETFs that are green on the weekly – those in bold are consecutive days in the Hot Corner):
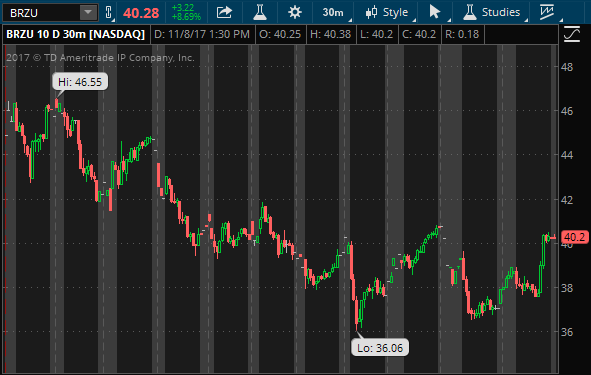
BRZU, DRIP, LABD (LABD new green weekly
Cold Corner (the biggest move lower 3% or more that are green on the weekly and or weekly/monthly or turned red on the weekly – those in bold are consecutive days in the Cold Corner):
BZQ, GUSH, LABU, (BZQ and DGLD new red weekly’s)
Green Weekly’s
These are the ETFs that have turned green on the weekly and the dates they turned green. This is used for tracking your percentage gains so you know when to take profit for each ETF per the Trading Rules profit taking guidelines. These green weekly’s work as you can see from the %Gain/Loss tables. You won’t get the exact high with your trade but you will also be out typically well before they start to fall again or turn red on the weekly. Your best way to profit with the service is stick with the green weekly trend and take profit while using a trailing stop on remaining shares. Also, if these green ETFs are up for the day at the open, they offer the best scalping opportunities. I am always fine tuning this section so if there is confusion at all, email me and be specific and I’ll be happy address.
I know I have said this many times but it is worth repeating; If you stick with the green weekly trades your odds of profit increase as there is more risk with the day trades. I call the day trades with the intent of catching some runners, so will get a few 1% stop outs but eventually catch the 5% to 10% or more runners. The important part of the list below is that the longer the ETF stays on the list (the one’s at the top of the list by Entry Date) the more likely it is to turn red on the weekly and the opposite ETF comes into play as a long.
Sell half shares on a spike up on any ETF you are long, even if goal is higher. Spikes higher are almost always followed by moves in the opposite direction. Try and get out with a market order quickly before the quick move back lower. Lock in that profit!