ETF Trading Research 4/18/2017
Today’s Trades – Current Trades (Non-Green – Bought/Sold/Hold) – Those highlighted in Yellow we are still long.
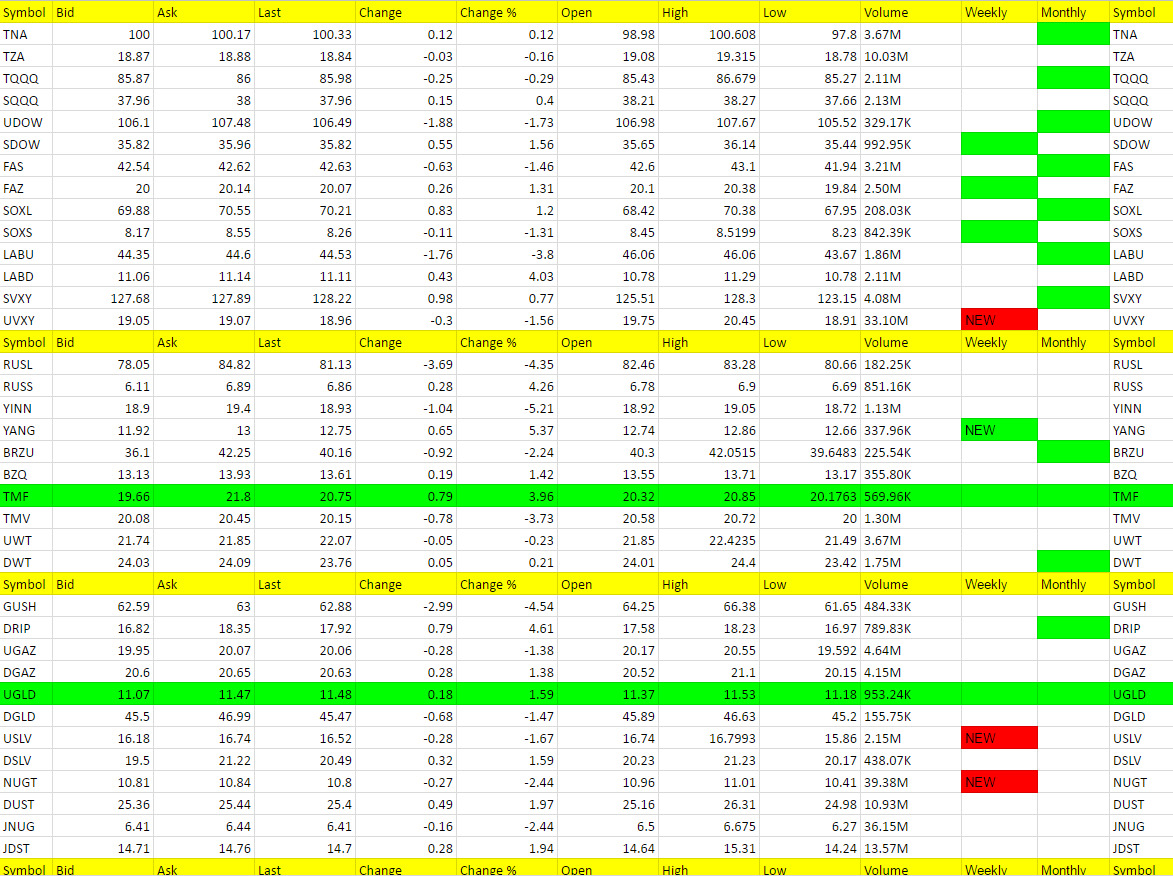
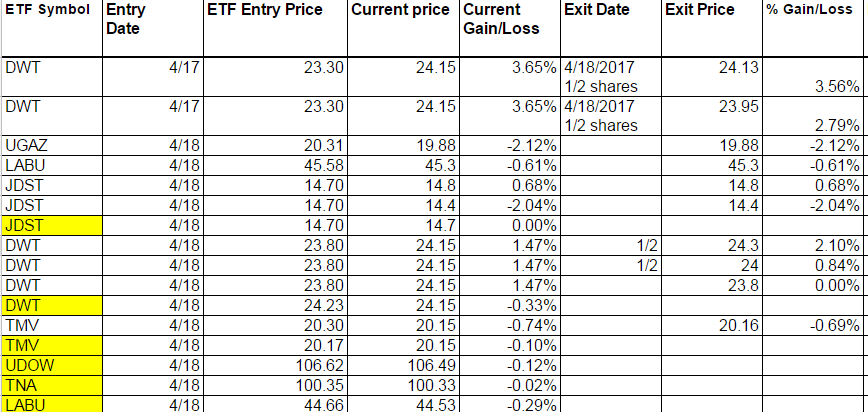
Expected more out of JDST today after such a good move overnight where I wish we didn’t get stopped out at the close. DWT was the trade of the day. UGAZ and LABU a disappointment early. If you look at the green weekly disappearing I think a change is coming in the markets and my choice of change was long the market ETFs with UVXY turning red on the weekly. So end of day with Trumps pro-America speech we went long TMV, UDOW, TNA and LABU (LABU only because he mentioned health care).
Economic Data For Tomorrow
Crude Oil Inventories at 10:30. Expect some volatility in oil until the data comes out but we will lean long DWT right now.
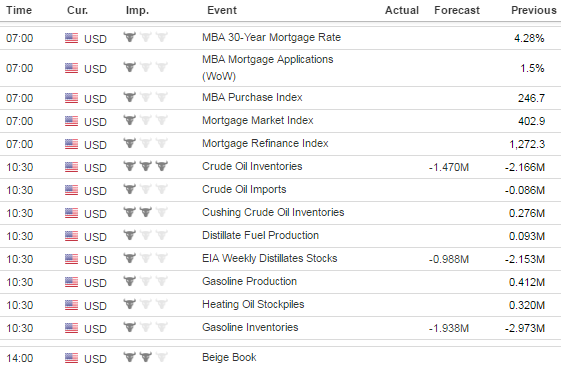
http://www.investing.com/economic-calendar/
Stock Market
Markets shrugged off any early good news in Housing as it didn’t like that Goldman Sachs didn’t beat expectations. Manufacturing data wasn’t good either and the market tried to rally once but just moved lower, rebounding a bit late afternoon. Trumps words were actually pretty good today in his speech and that is why I acted like the market normally does after his lip service and went long. But didn’t get the quick move I expected so will have to wait till tomorrow and see what the market gives us.
Foreign Markets
YANG triggered on the weekly and we’ll have to see what we can get out of it with a potential market bounce coming. If we do fall YANG should do ok and be your insurance against your longs a bit. But there is a chance that YANG may do well simply because of the President Trump Executive Order that was pro-American companies. This would by default mean negative every other country which would include China at the top of this list.
Interest Rates
With the further move up in bonds a flip to TMV could be profitable if we do get the market turnaround higher.
Energy
Crude Oil Inventories at 10:30. Expect some volatility in oil until the data comes out but we will lean long DWT right now. The trade has worked for us so far and we have more confidence with UWT having turned red on the weekly and oil staying under 53. Next step we need to break 52 and maybe get a green weekly going for us.
Precious Metals and Mining Stocks
This has been some of the most bizarre happenings I have seen in awhile with metals. The dollar falling hard should have got gold going but did not. It should have then maybe got JNUG or NUGT going but they were negative all day. JDST was the play but after the open we never got a run higher. We’ll see what tomorrow brings but any dollar bounce now or gold retreat and JDST should take off. I will still put a buy in on JNUG which is safe to play for day trades still. Plenty of volume/liquidity. Gold is down $3 to 1289.40.
We sold out of DSLV a little bit early. Could have got us a bit more profit. It did move up but then fell back some. We still might have an entry on it tomorrow. Silver is up 2 cents to 18.30.
The dollar stopped falling and is treading flat at 99.41.
From the Trading Desk
Escalating tensions with North Korea have kept gold buoyant and hovering right under the highs of 2017 thus far. On Sunday, North Korea attempted a missile launch (non-nuclear) but it failed “almost immediately” according to South Korean and US military officials. The launch took place just hours before US Vice President Pence arrived in South Korea for a visit. Also, satellite images suggest that North Korea is ready and willing to carry out another nuclear test. This information comes just one day after North Korea warned that it would strike the US mainland at any sign of aggression from the US government (analysts believe it doesn’t have this capability yet though). VP Pence has remarked that “all options are on the table” when it comes to North Korea and has warned the country to not test Trump’s “resolve”. Gold has stalled over the last few days ahead of formidable resistance at $1,300, but if the North Korean situation deteriorates further, it will easily break through this level. CFTC data showed that investors added to long positions on the Comex last week and the SPDR gold ETF’s holdings stand at 27.2 million ounces, five month highs.
Hot Corner (the biggest movers – 3% or more – or new ETFs that are green on the weekly – those in bold are consecutive days in the Hot Corner):
YANG, DRIP, RUSS, LABD, TMF (YANG new green weekly)
Cold Corner (the biggest moved lower 3% or more that are green on the weekly and or weekly/monthly or turned red on the weekly – those in bold are consecutive days in the Cold Corner):
YINN, GUXH, RUSL, LABU, TMV (NUGT, UVXY, USLV turned red on the weekly)
Green Weekly’s
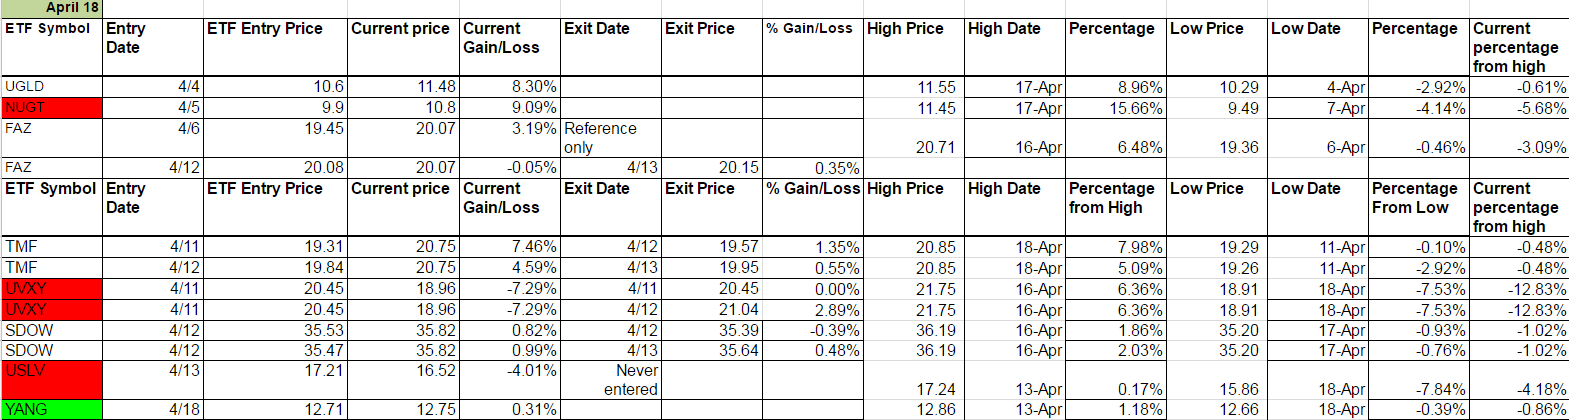
These are the ETFs that have turned green on the weekly and the dates they turned green. This is used for tracking your percentage gains so you know when to take profit for each ETF per the Trading Rules profit taking guidelines. It is also used for tracking the percentage from high to keep a stop on remaining shares. These green weekly’s work as you can see from the %Gain/Loss tables. You won’t get the exact high with your trade but you will also be out before typically well before they start to fall again. Your best way to profit with the service is stick with the green weekly trend and take profit while using a trailing stop on remaining shares. Also, if these green ETFs are up for the day at the open, they offer the best scalping opportunities too. I am always fine tuning this section so if there is confusion at all, email me and be specific and I’ll be happy address.
I know I have said this many times but it is worth repeating; If you stick with the green weekly trades your odds of profit increase as there is more risk with the day trades. I call the day trades with the intent of catching some runners, so will get a few 1% stop outs but eventually catch the 5% to 10% or more runners. The important part of the list below is that the longer the ETF stays on the list (the one’s at the top of the list by Entry Date) the more likely it is to turn red on the weekly and the opposite ETF comes into play as a long. You’ll notice in the last column on the right it says “Current percentage from high.” This is your normal stop out for any ETF where I don’t specifically call it per the Trading Rules which lists the trailing stops for each ETF. It is a Trailing Stop percentage from the high and I have noticed the pattern that the closer it gets to 5% the sooner the ETF turns red on the weekly.
YANG is the new green weekly. Notice the sheet is dwindling. Should mean some new trends coming soon.