ETF Trading Research 4/20/2017
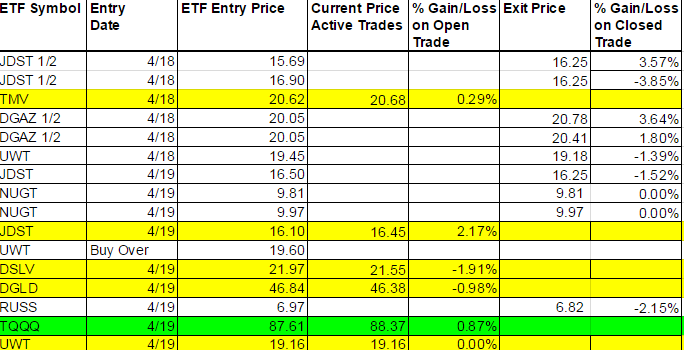
Today’s Trades – Current Trades (Non-Green – Bought/Sold/Hold) – Those highlighted in Yellow we are still long.
Economic Data For Tomorrow
Tomorrow we have Manufacturing PMI and Existing Home Sales as the market moving data and watch at 1pm for the Oil Rig Count if trading oil. Brazil holiday tomorrow.
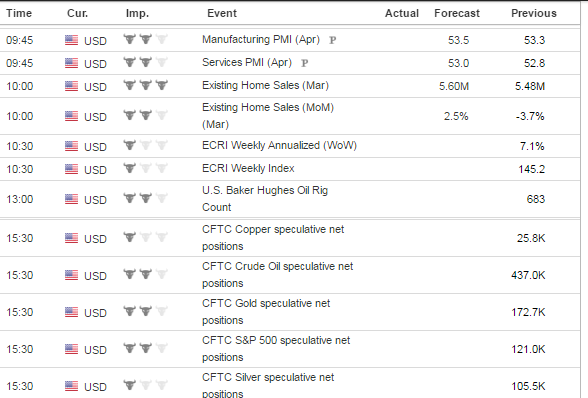
http://www.investing.com/economic-calendar/
Stock Market
Was interesting today to see such lousy data come out for Initial Jobless Claims and Philly Fed Manufacturing and yet the market shook it off and shot up higher. We did get long and catch some of that with a new long in TQQQ, but didn’t really appreciate the end of day pullback a bit.
Foreign Markets
Stopped out of YANG and RUSS for small losses. Not appreciating there is not continuation in YANG each time we get it green. At some point there will be a 20% plus trade there if not more. BZQ triggered green on the weekly and is a buy at the open.
Interest Rates
TMV moved to a higher high today which is what we want. Pulled back with market end of day though.
Energy
I really thought we were topping in UWT today and after the market open tried it again for a small loss, but we let the market take it down and bought end of day. It is up a little from the close. Should get a pop in the morning I think. Oil futures 50.71. Remember, oil rig count data at 1pm.
Precious Metals and Mining Stocks
JDST should have done better I think with the dollar rebound. Up on the current trade but gold has to get going below 1280. It almost broke through that 1277 number and maybe will tomorrow so our trades can be profitable.
Silver did move lower and we finally got long DSLV again. Need it to stay under 18.
IMPORTANT: What may keep metals up a bit longer is the French vote coming this weekend. But it is more hype than anything else. Next week we should be lower in metals.
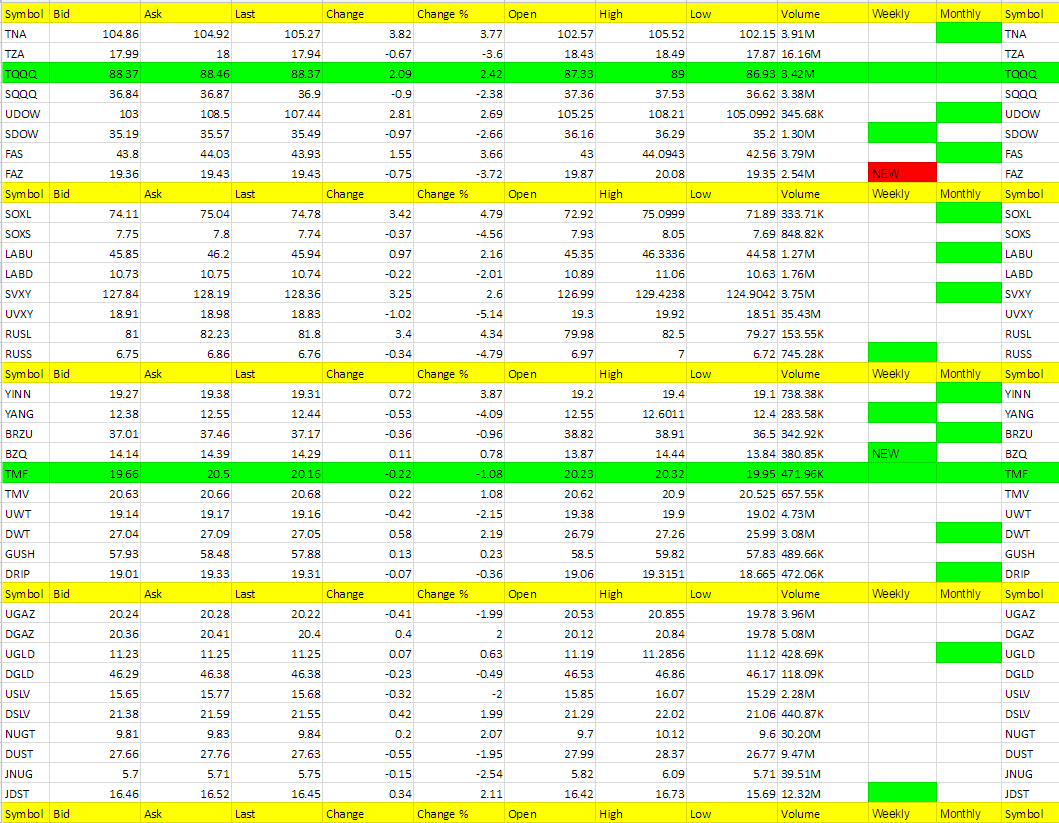
Hot Corner (the biggest movers – 3% or more – or new ETFs that are green on the weekly – those in bold are consecutive days in the Hot Corner):
SOXL, RUSL, YINN, TNA, FAS (TQQQ and BZQ new green weekly’s)
Cold Corner (the biggest moved lower 3% or more that are green on the weekly and or weekly/monthly or turned red on the weekly – those in bold are consecutive days in the Cold Corner):
UVXY, SOXS, RUSS, YANG, FAZ, TZA (FAZ turned red on the weekly)
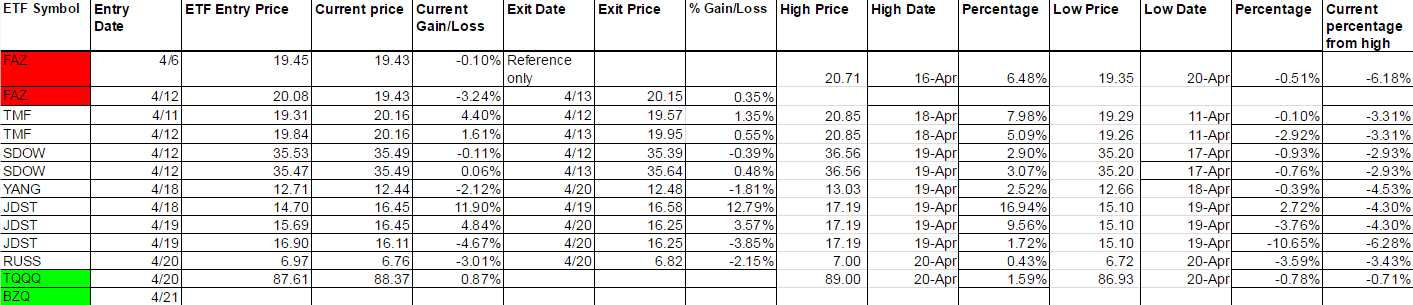
Green Weekly’s
These are the ETFs that have turned green on the weekly and the dates they turned green. This is used for tracking your percentage gains so you know when to take profit for each ETF per the Trading Rules profit taking guidelines. It is also used for tracking the percentage from high to keep a stop on remaining shares. These green weekly’s work as you can see from the %Gain/Loss tables. You won’t get the exact high with your trade but you will also be out before typically well before they start to fall again. Your best way to profit with the service is stick with the green weekly trend and take profit while using a trailing stop on remaining shares. Also, if these green ETFs are up for the day at the open, they offer the best scalping opportunities too. I am always fine tuning this section so if there is confusion at all, email me and be specific and I’ll be happy address.
I know I have said this many times but it is worth repeating; If you stick with the green weekly trades your odds of profit increase as there is more risk with the day trades. I call the day trades with the intent of catching some runners, so will get a few 1% stop outs but eventually catch the 5% to 10% or more runners. The important part of the list below is that the longer the ETF stays on the list (the one’s at the top of the list by Entry Date) the more likely it is to turn red on the weekly and the opposite ETF comes into play as a long. You’ll notice in the last column on the right it says “Current percentage from high.” This is your normal stop out for any ETF where I don’t specifically call it per the Trading Rules which lists the trailing stops for each ETF. It is a Trailing Stop percentage from the high and I have noticed the pattern that the closer it gets to 5% the sooner the ETF turns red on the weekly.
Yesterday I said; “If things go to scale, FAZ and TMF and SDOW should be the next to turn red on the weekly.” FAZ did turn red on the weekly. SDOW should tomorrow. BZQ a buy at the open. It’s a tough one for me if we are short Brazil and yet RUSS and YANG failed. So I would go lighter shares. We haven’t done much trading in Brazil so we will see how we do as the percentage moves are usually pretty strong. Holiday in Brazil tomorrow too. Stops should be 3% on BZQ.