ETF Trading Research 5/14/2017
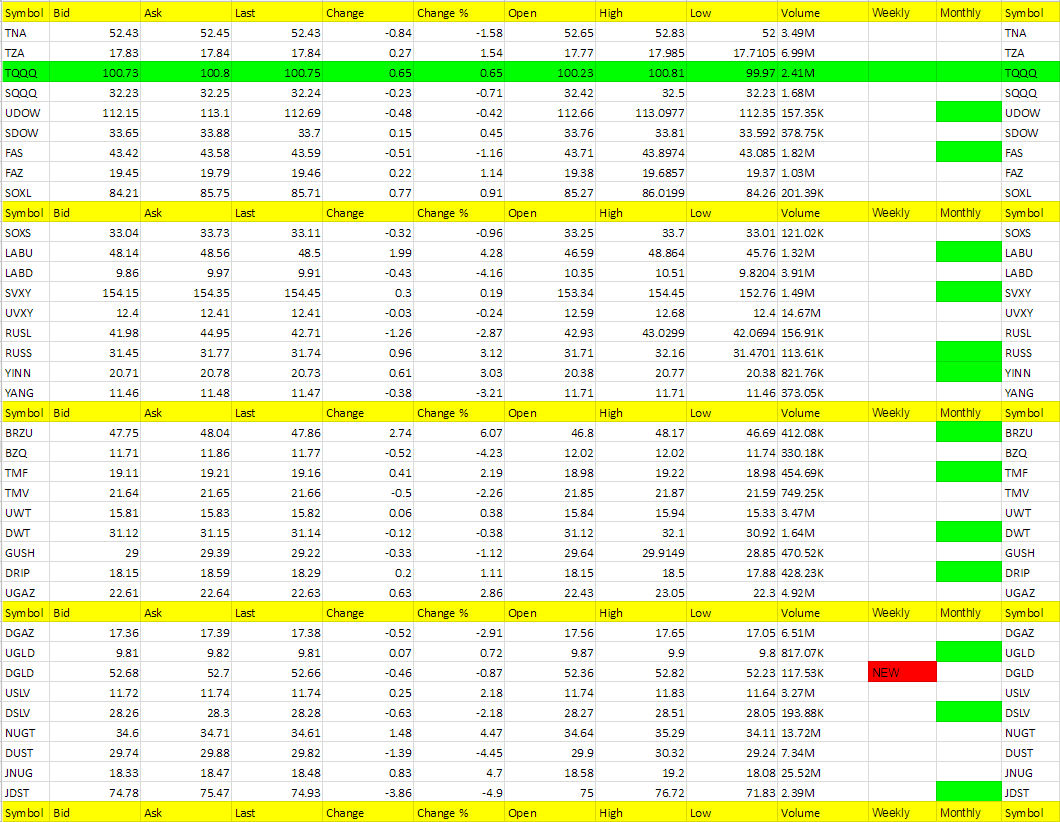
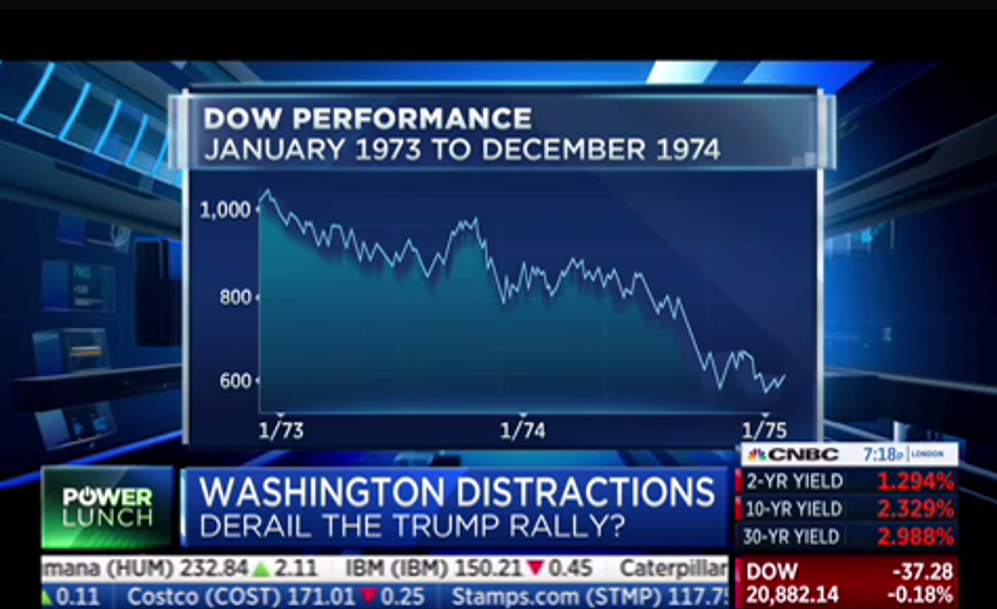
First thing I want to point out about our present situation in the markets for trading is what is circled below. There is no clear trend right now in much of anything. I do think we will head the direction of the mutual fund though, as trend reversals typically come. Even CNBC as you can see in the second graphic is showing a potential of a 1973/1974 episode of a crash coming. Of course their “reasoning” is Trump/Comey related, which makes no sense to me. Yes, they are distractions, but losing faith in the market distractions? Can’t get behind that but they have to have some excuse to explain the markets weakness. All I need to do is look at FAZ and TMV to know we are weak each day. Plus that empty Weekly column that is circled. One other way to look now at the table below. and this is living proof to me of what is keeping the market afloat, is the fact that TQQQ is all that is holding up the markets. In other words, FANG or Facebook, Apple, Netflix, Google (called Alphabet now). Nothing more. I think that will change this week and is why we are long SQQQ. I looked back over my data and I actually had UDOW turning red on the weekly after Thursday. It wasn’t why we got long SDOW on Friday, but at least it is now confirmed in my mind that we might have got an early jump in it by going long and holding. These two aren’t high flyers so if wrong we won’t get hurt too much from them but judge for yourself from all you see and I think you would agree being a little early is ok overall and that is why I started the mutual fund. I want a longer term mindset here and not get washed out quickly by a decline, hence no stops at present. Of course I will monitor hourly. There’s not going to all of a sudden be something that will push markets higher here. Tax Plan, Trumpcare, euphoria is done. We can still keep an eye on LABU though if the drug companies find a way to benefit themselves.


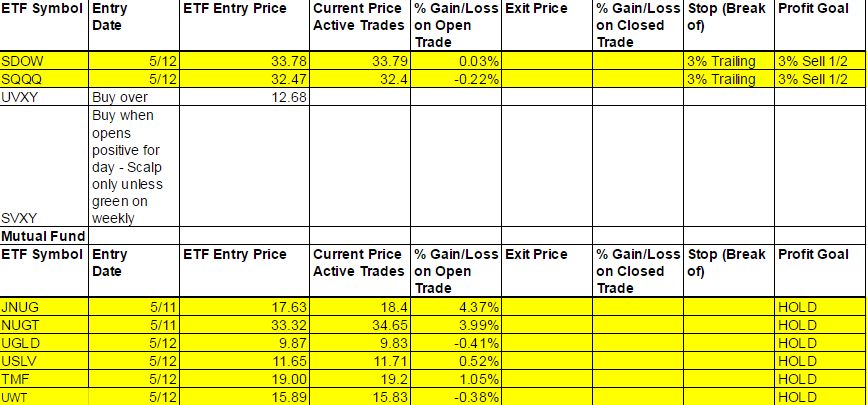
Current Positions
I kept the buy price on for UVXY below because I want to remind us of where we were going to buy on Friday, but never did. If I am right that markets are turning, then UVXY can have room to run so I want to keep an eye on it. I also am keeping SVXY on the list for any day it is up for the day as a scalp. I will remove it if we go the route of 1973-1974 naturally.
Economic Data For Tomorrow
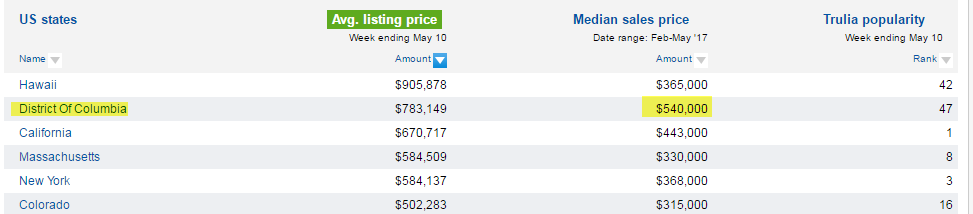
Retail sales disappointment gave us what I expected on Friday. I sent out a special alert that you will want to read called Market Update – The Coming Fall in the Markets? Bull or Bear Analysis. If you can’t find it email me and I will send. I make the case that the Fed can’t see what’s really going on and that retail sales are proof along with how busy restaurants are. Won of you that lives in the DC area said business is booming for restaurants there. This I actually understand as Washington politicians and the ones who wine and dine them have all the money. Thanks for sharing Lori.

Foreign Markets
Got whiplashed hard in Foreign ETFs. I thought they would begin a nice decline with the markets but it is almost as if money flowed out of U.S. into Foreign markets. Neutral at present but will look for all 3 ETFs we follow to be in the same side for strength of trend.
Interest Rates
I said for Friday’s report that TMF is one I am considering for the Mutual Fund. Looks like a double bottom on the chart at 18.75 here. It did double bottom and we got long for the mutual fund. 19.16 presently.
Energy
Nat Gas we will go long whatever is positive or up for the day.
UWT seems to be ready for a move with oil, but the data is still not supporting it. I put it on the mutual fund list for the reason it is poised to move higher, geopolitical reasoning and price action. I did label it the most risky and after I put it on the list it fell but then bounced right back up.
Precious Metals and Mining Stocks
I made the case for gold bottoming in the report for Friday and Friday we got a bounce to over 1230 which is what we wanted, but it settled down. Still, it was enough to knock us off of DGLD as it turned red on the weekly. We added UGLD and USLV to the mutual fund as I think they are primed for a run here. Below is the graph from Thursday night and gold closed over 1227.

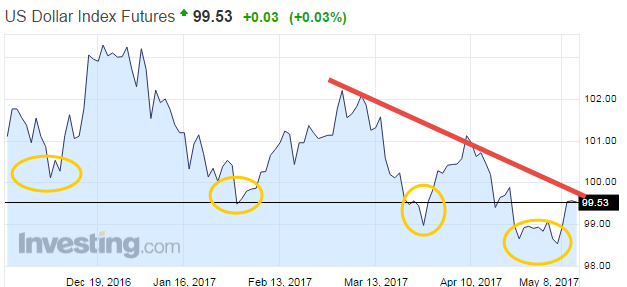
The dollar also fell and the chart below from Friday’s report showed the potential of that. The dollar fell to close at 99.05 on Friday.
Hot Corner (the biggest movers – 3% or more – or new ETFs that are green on the weekly – those in bold are consecutive days in the Hot Corner):
BRZU, NUGT, JNUG, YINN, (UGAZ came close at 2.77%).
Cold Corner (the biggest moved lower 3% or more that are green on the weekly and or weekly/monthly or turned red on the weekly – those in bold are consecutive days in the Cold Corner):
JDST, DUST, LABD, BZY, YANG – (DGAZ came close at -2.88%
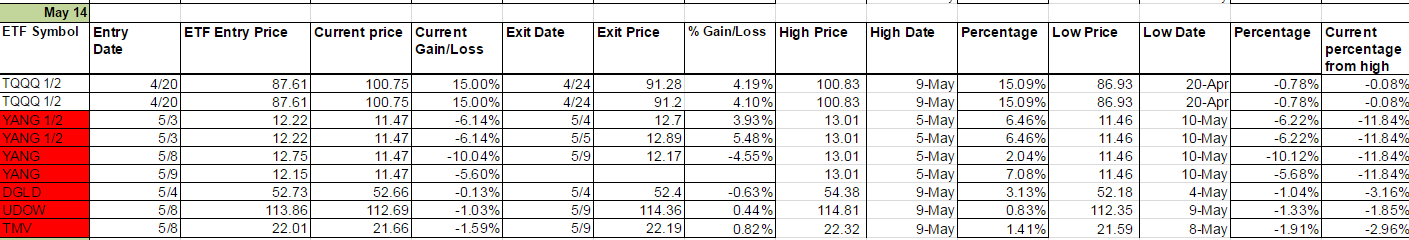
Green Weekly’s
These are the ETFs that have turned green on the weekly and the dates they turned green. This is used for tracking your percentage gains so you know when to take profit for each ETF per the Trading Rules profit taking guidelines. It is also used for tracking the percentage from high to keep a stop on remaining shares. These green weekly’s work as you can see from the %Gain/Loss tables. You won’t get the exact high with your trade but you will also be out before typically well before they start to fall again. Your best way to profit with the service is stick with the green weekly trend and take profit while using a trailing stop on remaining shares. Also, if these green ETFs are up for the day at the open, they offer the best scalping opportunities. I am always fine tuning this section so if there is confusion at all, email me and be specific and I’ll be happy address.
I know I have said this many times but it is worth repeating; If you stick with the green weekly trades your odds of profit increase as there is more risk with the day trades. I call the day trades with the intent of catching some runners, so will get a few 1% stop outs but eventually catch the 5% to 10% or more runners. The important part of the list below is that the longer the ETF stays on the list (the one’s at the top of the list by Entry Date) the more likely it is to turn red on the weekly and the opposite ETF comes into play as a long. You’ll notice in the last column on the right it says “Current percentage from high.” This is your normal stop out for any ETF where I don’t specifically call it per the Trading Rules which lists the trailing stops for each ETF. It is a Trailing Stop percentage from the high and I have noticed the pattern that the closer it gets to 5% the sooner the ETF turns red on the weekly.