ETF Trading Research 5/21/2017
Housekeeping note: I accidentally put TNA as green on weekly but it was TZA in Thursday’s nightly report. I corrected it.
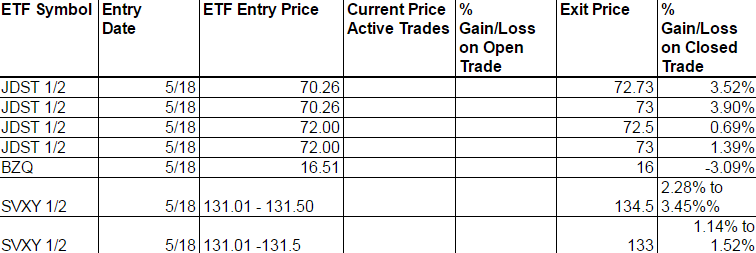
Current Positions and Today’s Trades
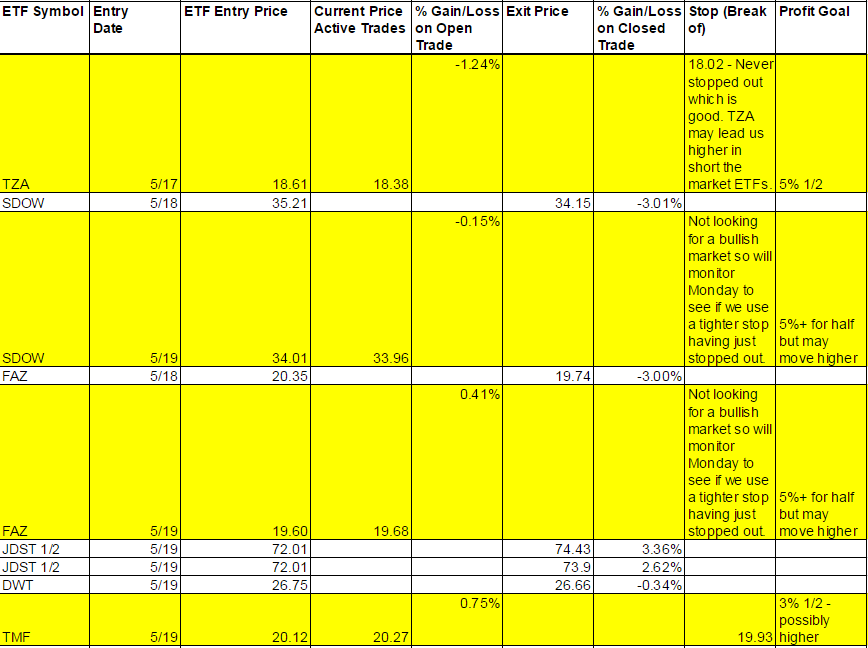
Missed the open trade in SVXY because of technical difficulties but I know some of you wrote me and got that trade, so good job. Did well with JDST but 2 of our green weekly’s never took off. We are back in them again and I do think all of the one’s in yellow before will end up overall making us some decent profit. I am expecting the markets to be lower by end of the week and heading into the 3 day holiday weekend. I also expect a slow day on Friday.
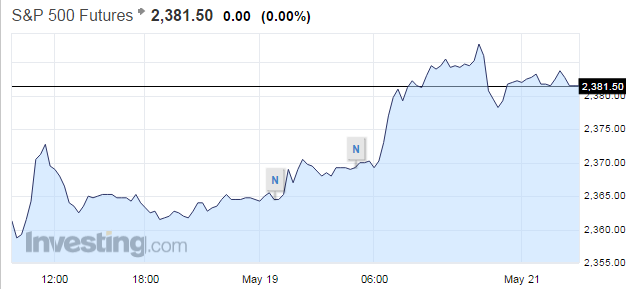
Data overnight had Japanese exports falling with Trade Balance and imports up. That’s not good for Japan. There is no U.S. data that is important for Monday but there are 4, yes 4 Fed members speaking. When they come out in force like this I believe they are trying hard to keep this market going. Causes me a little concern with the shorts. 2 More Fed members speak on Tuesday, Draghi on Wednesday and we have Fed Minutes being released on Wednesday. Might be a little volatile till Wednesday. Friday we have the GDP data so you’ll have to stick around for that rather than take off early for a long weekend, unless you decide to just be flat. Can be a volatile day Friday too.
No calls at present as we patiently wait for a trend. BZQ is not a trend after a one day move and then reversal in BRZU, so right now we will only be scalping one or the other. Might still be a little recovery in BRZU left so we’ll watch it.
Interest Rates
TMF we are up on and if I am right on the market decline, as micro as it always seems to be, we’ll shoot for our 3% or more profit or possibly hold longer if we can break last week’s lows.
Energy
The micro trend should still be a little higher in Nat Gas and UVXY and we are setting up for a double top as I outlined in an alert on Friday.
I think the next move is going to be DWT and we’ll look for it to possibly be the trade of the week. Always watch for the data releases and know OPEC can always say something to shake up the longs. But now that oil is over 50 again, the next trip should be below 50 so if you see oil ball below 50, then DWT is the call. 50.98 as I type. https://m.investing.com/commodities/crude-oil
Precious Metals and Mining Stocks
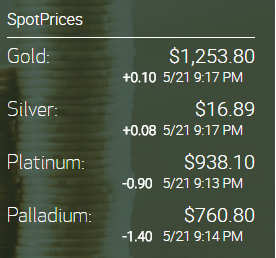
With metals up on Friday I know it wasn’t easy to be concentrating on JDST but we did and profited. This is a classic example of following price action. By the end of the day you saw a little bounce in JNUG and we were on the sidelines as I was tempted to go long but decided to hold off. I do think we get one more downturn in miners and metals and we should be setting up for a long trade in metals by next week. Timing the exact bottom won’t be perfect, but if we do fall lower, then some of you might want to consider cost averaging into a long position in NUGT and/or JNUG along with UGLD and USLV. Meanwhile we’ll trade JDST if the opportunity presents itself. The dollar is due for a bounce and they also may help JDST. At least for the short term. When we take off in metals this time, next stop $1,300+ I think.
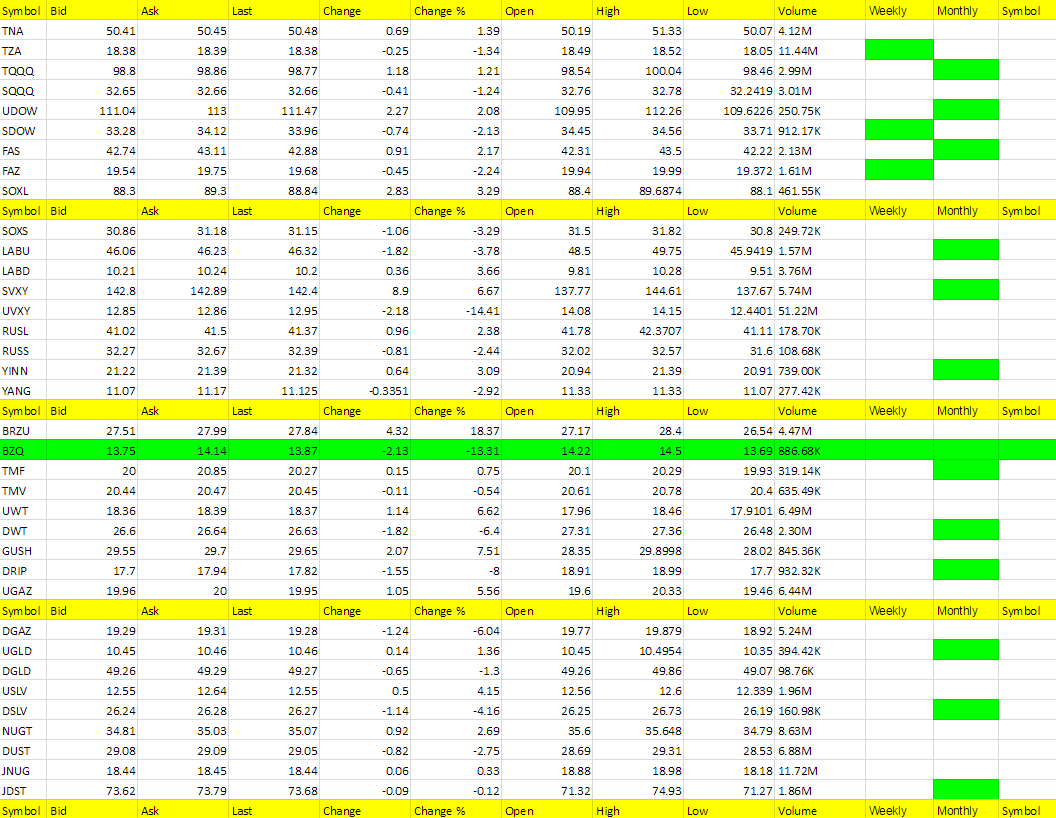
Hot Corner (the biggest movers – 3% or more – or new ETFs that are green on the weekly – those in bold are consecutive days in the Hot Corner):
BRZU, GUSH, UWT, SVXY, UGAZ, USLV, LABD, NUGT
Cold Corner (the biggest moved lower 3% or more that are green on the weekly and or weekly/monthly or turned red on the weekly – those in bold are consecutive days in the Cold Corner):
UVXY, BZQ, DRIP, DWT, DGAZ, DSLV, LABU, DUST, SOXS, YANG
Green Weekly’s
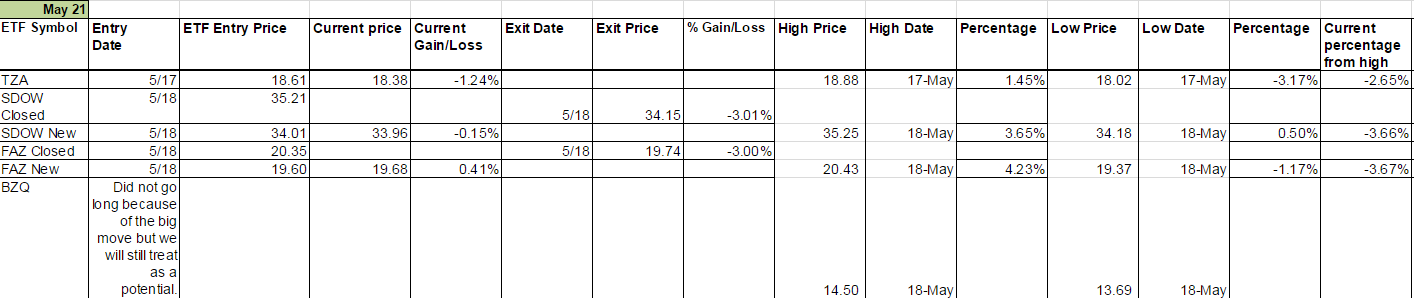
These are the ETFs that have turned green on the weekly and the dates they turned green. This is used for tracking your percentage gains so you know when to take profit for each ETF per the Trading Rules profit taking guidelines. It is also used for tracking the percentage from high to keep a stop on remaining shares. These green weekly’s work as you can see from the %Gain/Loss tables. You won’t get the exact high with your trade but you will also be out before typically well before they start to fall again. Your best way to profit with the service is stick with the green weekly trend and take profit while using a trailing stop on remaining shares. Also, if these green ETFs are up for the day at the open, they offer the best scalping opportunities. I am always fine tuning this section so if there is confusion at all, email me and be specific and I’ll be happy address.
I know I have said this many times but it is worth repeating; If you stick with the green weekly trades your odds of profit increase as there is more risk with the day trades. I call the day trades with the intent of catching some runners, so will get a few 1% stop outs but eventually catch the 5% to 10% or more runners. The important part of the list below is that the longer the ETF stays on the list (the one’s at the top of the list by Entry Date) the more likely it is to turn red on the weekly and the opposite ETF comes into play as a long. You’ll notice in the last column on the right it says “Current percentage from high.” This is your normal stop out for any ETF where I don’t specifically call it per the Trading Rules which lists the trailing stops for each ETF. It is a Trailing Stop percentage from the high and I have noticed the pattern that the closer it gets to 5% the sooner the ETF turns red on the weekly.
