ETF Trading Research 10/22/2017
For those of you new here, I most of the time have the ETF Trading Research report out by 8PM PDT, and it comes by an RSS feed, but you can look at the report here sometimes before you get it in your mailbox; https://illusionsofwealth.com/category/etf-blogs/ This is also the same link if there are any technical difficulties.
NOTE:
Before jumping into any observations for the week, I want to make it a point to explain why I created the Day Trading Rules, and why they are important to follow more than anything that I may say on a daily basis. These Trading Rules trump anything I say; period. They are written to control my own behavior as I am human and will think one way, when the market goes another way. I should be called out by you call each and every time I break my own rules and hopefully I stop being stubborn and go against the market price. The issues of late is I have Swing Trades going where one is going the other way, and I still think we are going the other way higher.
Personally, I can call a micro market one way, and a macro view another way, especially with leveraged ETFs, but I can see how this can get us into trouble. The problem I have, is I have many who can’t day trade and they ask me over and over for swing trade calls. So I implemented the section for swing trades. But those should have possibly their own rules associated with them too, or so I it seems they should. I am clear in the Trading Rules that no matter what I say, -5% should be the most anyone EVER loses with one trading call, no matter what. I have to put this on any and all trades called. Even Swing Trades. But I understand on Swing Trades, one might take a little more risk in hopes of a bigger reward. I understand this psychology. But what about your profit goals for Swing Trades? There should be a goal there too, or at least a money management system for these trades.
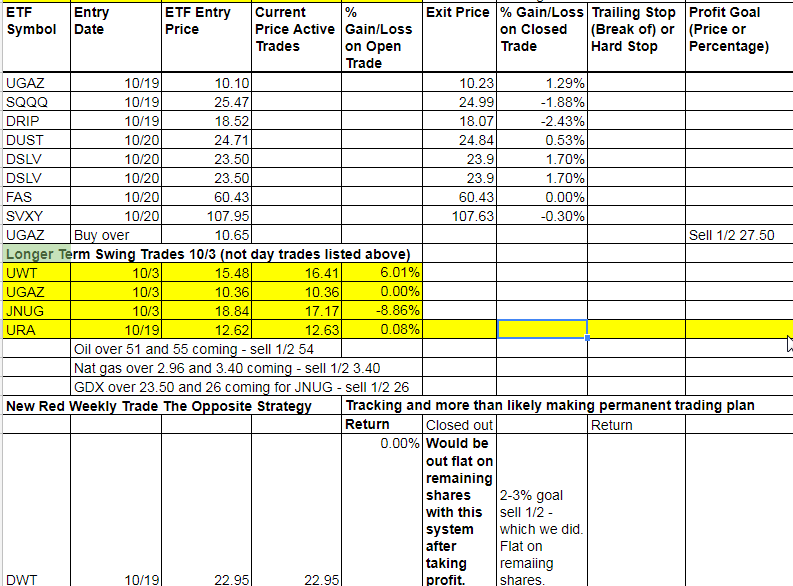
The current Swing Trades were up to the following highs already;
JNUG 9.97% on 10/9 but is -8.86% now.
UGAZ 7.53% on 10/11 but was -7.52% before that occurred.
UWT 7.56% on 10/17 but was -5/62% before that occurred.
You see the problem here? In each case, with a -5% stop we may have been kicked out of our position immediately after a call or on a trailing stop. Each case we had good returns followed by bad returns. However, something interesting is that in no case, (until Monday of course with JNUG more than likely) did we have more than a -10% drawback or +10% gain.
So what is the best plan to trade these? What is your goal here Doug?
My goal is to get 20% or more returns on all of these, however, OUR goal is to take profit and never let a good profit turn into a loss, let alone a big loss. So even as a swing trader, you need to manage these trades. As much as I want to believe in my continued mantra of 1400+ in gold, 3.40 in Nat Gas and 54/55 oil, a swing trader must take profit and keep stops too. We just can’t buy and hold these to bigger losses, as much as we want to and probably be will rewarded at some point, with big gains.
This last month of trading has been something else. I’ll take some responsibility in some of my calls in metals and miners not being my best, although I will use the excuse that those day trades I kept from 9/15 did return to break even at least twice and I did say before the Fed day when they started to tank, that conservative traders can sell Pre-Fed, as well as warning in the Trading Rules about Fed weeks being volatile. But I also realize with some of you that what I say can influence you to break rules. You must follow the -5% rule no matter what I say. Simple as that. These trading rules are written to control ME and as I know I will get stubborn. So they are then written for YOU also. Remember that. If you control me and my mistakes with your comments to me, I may try and defend them, at first, but I also learn from them and continue to create a system that is fail proof, (or fool proof if one continues to break rules). That’s why I recently started the New Red Weekly Trade The Opposite Strategy. Here’s how to best use this to stay out of trouble, but at the same time, you’ll see probably in the next month here so magic start to happen. Why do I say magic? Because we haven’t been blessed yet with one of these going from a red weekly opposite to a green weekly yet. It will come. And yes, that is where the swing trader can make the real money. So if you are a swing trader, listen up. Follow the system below.
For New Red Weekly Trade The Opposite Strategy
- The last two years it has been rare to see a red weekly opposite reverse so quickly before a green weekly hits. Usually when a red weekly occurs, the opposite ETF is just beginning a run and more than likely will turn green on the weekly. But we just haven’t had that of late and that is why for now I have put the goal with them of a smaller gain for 1/2 shares that seems to work more than not of 2% to 3%. But we also need to put a smaller stop out of -2% to -3%.
- There will come a time when some of these hit that we get a run. Earlier this year when an ETF hit green on the weekly, we saw several times an ETF going up 20% or more. Many times we were taking 10% quick moves. We haven’t seen much of this in the last month, but we will again. This system will work, just watch.
- After getting profit on 1/2 shares, keep a stop on the remaining shares at break even and protect the downside.
- However, if the ETF does go up from that profit taking area, it could turn green on the weekly. If it turns green on the weekly, then we turn to our profit taking goals listed in the Trading Rules or keep a trailing stop for the downside. We should more than likely have as a worst case scenario our original spot where we took the 2% profit, but look to the days again when some of these run for us.
Lastly, I had dinner with a subscriber who kindly said something to me, that he originally said I may take offense to, but instead I 100% agreed with him. He said I have a tendency to negative this market. I do, and have been, but I know I am not alone. To overcome this issue I have, I implemented the rule to buy SVXY any day it opens higher for a scalp. Is anyone doing that? Probably not. But it is another rule to overcome my weakness as a trader, or more importantly, my bias. So let’s see how SVXY would have done that last 2 weeks with this strategy, when it opened higher than the day before.
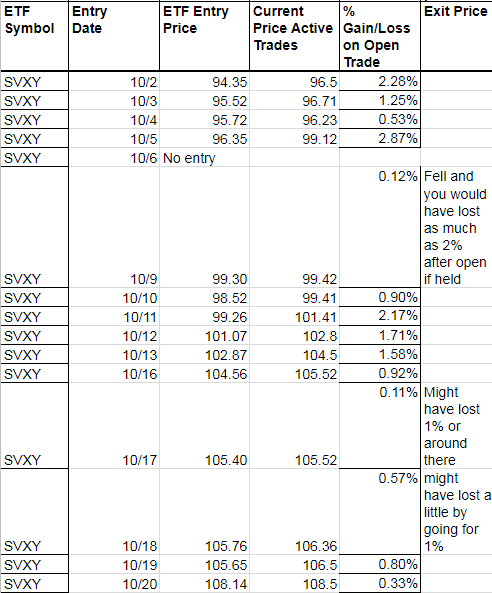
The best way to trade this strategy is to buy at the open and use 1% stop and 1% goal and sell half with a half percent trailer in my opinion.
And guess what? I’ll still keep my negative bias and I think we can possibly use this strategy with UVXY and get rewarded much more in the weeks and months to come.
The bottom line, I know many of you know I do my best to provide you with opportunities to profit. I learn from my mistakes and created the Trading Rules to keep me, and us, in line and not let our losses get out of control. With the introduction of a mutual fund or swing trade approach, each time it confuses the rules because of what I see coming. But we need to still have rules. Instead of a Swing Trade column, consider each ETF that we trade the opposite of a red weekly a good swing trade opportunity and you can pick and choose the ones you want to trade long when they trigger. My favorites will be UGAZ, NUGT (if DUST turns red on the weekly, JNUG would hit too but we may have JDST trigger Monday and then it will have it’s own signal of red to trade JNUG long), RUSS, BZQ and YANG when their opposites turn red on the weekly. I really feel some incredible returns are coming here, but we know very well nothing moves in a straight line.
Any confusion on this or the trading rules, shoot me an email. I want to personally thank David C. for the back and forth we have on this. It’s a struggle at times, but from struggles can come some great things with this trading service. I believe in that and hope you do too.
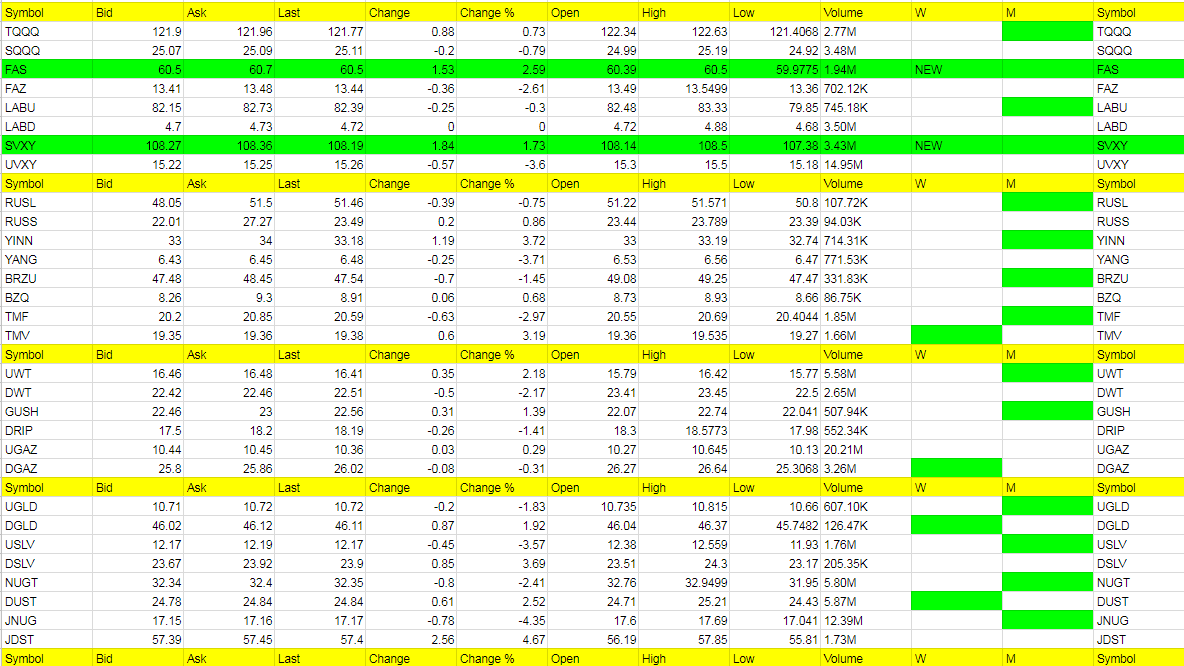
Today’s Trades and Current Positions (highlighted in yellow):
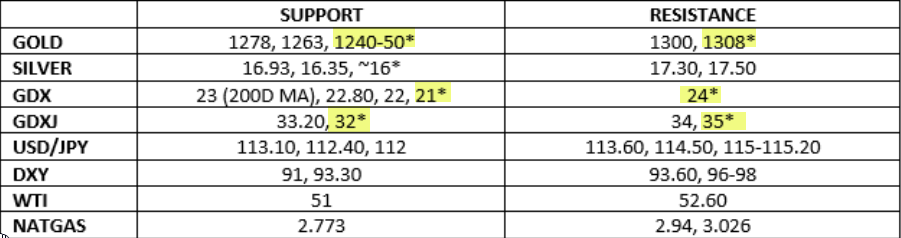
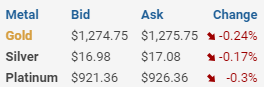
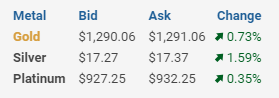
New support and resistance levels. I highlight the ones in yellow for what gold bulls need. 1308 is the magic number for the bull run higher. We just broke through the 1278 level (1280 from last week) on gold and are at 1274.70 as I type. Silver 16.97 and close to breaking down as well. We went flat on Friday as I didn’t want to take any risk and we’ll look for a trade on Monday. The further metals and miners fall, the more I will look to go for some scalps possibly, with tight stops, for any potential reversals. We will eventually put on the trade to buy JNUG and any other metals/miners at any point in time they go positive or open positive for the day and flip the market maker the bird showing we are not afraid of them because we’ll keep stops if they reverse it on us. Eventually we will take them to the cleaners. By the time we open on Monday, gold could be down big, possibly to our support level of 1263. The 1240/1250 level is listed and I do see that as the bottom. You’ll see the 114.50 level there for USD/JPY and that is a triple top that we have said could be where the metals and miners are worth a long. The USD/JPY is 114.06 as I type. We’ll see if our top and bottom come in together for gold and USD/JPY but they look to be a little off to be an exact bottom and top for each.
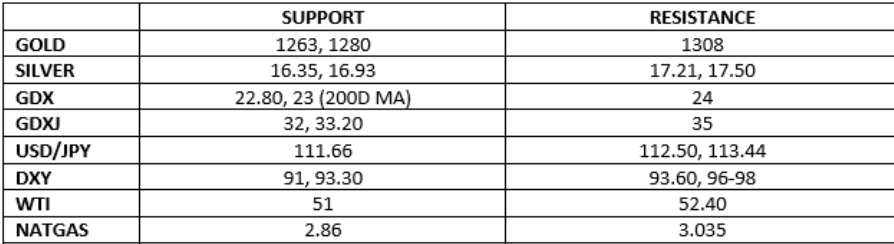
Prior support and resistance levels.
We had a flat day overall on Friday with some winners and losers. SQQQ and DRIP were disappointments while UGAZ, DUST, DSLV we did ok with.
Economic Data For Tomorrow
No real data for Monday. GDP Friday is the big one for the week.
http://www.investing.com/economic-calendar/
Precious Metals and Mining Stocks
USD/JPY took off higher and that is putting pressure on metals, knocking them down to the levels we have discussed. Further analysis below.
It’s clear that Funds are not buying this rally in the dollar index because they remain net short. This means that the possibility of a massive short squeeze is very real.
However, though this may be negative for metals, I am not sure it will be. $/JPY has been trading independently of DXY, which is euro dominated, for quite some time. If DXY does rise, $/JPY could still fall, boosting metals. It’s not a slam dunk. Gold and the $ could rise together, though I agree that a general dollar rally could hit metals too.
COT Data on the dollar.
- DXY back to neutral, worked off its overbought condition, now ready to head higher again imho. RSI 50, MACD H flat, MACD line moving sideways to down but about to turn up again imho. 96-98 here we come.
- Holding support at 93 on a weekly basis – key pivot. Weekly up from 24 to 40 RSI, lots of room to go on the upside. MACD H just broke zero and heading higher after a massively overextended low. MACD line even moreso and just turned up and just broke its signal – lot of room higher here!!
- Monthly just turning up also – dollar going higher based on technicals!!
- DSI: 71 (Can go higher and stay there for a while)
Arguments For and Against Gold
Arguments that Gold goes higher from here…
- Has held daily support trendline since Jan 27 at ~1278 for 3 days in a row. A higher low and about to head higher from here.
- Bullion Banks are maintaining a low net short position in anticipation of a mega rally shortly and leaving the heavy lifting on the short side to the Producers / Miners.
- Sentiment has fallen back again but to a higher low and is about to take off again. Fact that Silver has outperformed on this pullback, based on its DSI divergence to Gold (52 vs 32), is bullish as Silver leads in bull markets.
- USD/JPY becoming O/B (RSI 63) and also needs to head lower based on the daily MACD line which is still over-extended to the upside
Arguments that Gold heading lower still before the next rally can occur…
- After a brief pop up, Gold looks ready to fall even lower… Hugging daily trendline support but cannot seem to bounce. Once thru, will slide fast.
- RSI & MACDs turning down again. MACD H about to cross zero to the downside. Not a buy until RSI hits 30, now 42.
- Weekly momos also heading south too. Monthlies sideways to lower also.
- Funds’ net long position and open interest both remain too high for a bottom worthy condition. Open interest has to fall below 500k contracts “at least”, currently 530k. Funds’ net longs need to get a lot lower, closer to neutral.
- Daily sentiment index, 32, has fallen back but is still 9 points above the low on Oct 5th at 23. For a true low to be in place, need to see the teens or lower, single digits. This implies there is further downside to come.
- Gold leads at turns, not Silver or Miners, and Gold is leading to the downside now, Silver lagging but it will catch up.
- That said mining stocks look awful. GDX momos all falling and below 50/0. Weeklies heading south now too. GDXJ broke a ST support TL Fri. All momos falling. Weekly MACD H about to cross zero to the downside.
- 114.50 USD/JPY is the key double top level that is like a magnet here, it’s so close. We need to see at least a retest, possibly break higher to as high at 115-115.20 before lower. Daily MACD H heading up towards zero. Weekly momos all heading UP… bullish USD/JPY, bearish Gold ST.
- TIPS keep falling. Hit a low of 113.30 Fri. 113.20 gets taken out and LOB. Close the gap to 112.30 next? RSI sliding to 42. MACD H just broke below zero. MACD line just turned down also, breaking signal line. 113 huge support on a weekly basis but momos look ominous, heading south. Monthly momos look like they’re running out of steam too.
Sunday Night Price
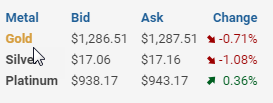
Thursday Afternoon Price
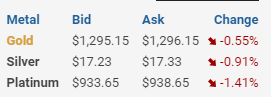
Wednesday Price
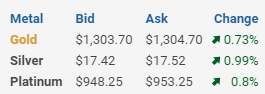
Tuesday Price
Monday Price
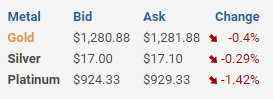
Friday Afternoon Price
Hot Corner (the biggest movers – 3% or more – or new ETFs that are green on the weekly – those in bold are consecutive days in the Hot Corner):
JDST, YINN, DSLV, TMV (FAS, SVXY)
Cold Corner (the biggest move lower 3% or more that are green on the weekly and or weekly/monthly or turned red on the weekly – those in bold are consecutive days in the Cold Corner):
JNUG, YANG, USLV, UVXY, TMF
Green Weekly’s
These are the ETFs that have turned green on the weekly and the dates they turned green. This is used for tracking your percentage gains so you know when to take profit for each ETF per the Trading Rules profit taking guidelines. These green weekly’s work as you can see from the %Gain/Loss tables. You won’t get the exact high with your trade but you will also be out typically well before they start to fall again or turn red on the weekly. Your best way to profit with the service is stick with the green weekly trend and take profit while using a trailing stop on remaining shares. Also, if these green ETFs are up for the day at the open, they offer the best scalping opportunities. I am always fine tuning this section so if there is confusion at all, email me and be specific and I’ll be happy address.
I know I have said this many times but it is worth repeating; If you stick with the green weekly trades your odds of profit increase as there is more risk with the day trades. I call the day trades with the intent of catching some runners, so will get a few 1% stop outs but eventually catch the 5% to 10% or more runners. The important part of the list below is that the longer the ETF stays on the list (the one’s at the top of the list by Entry Date) the more likely it is to turn red on the weekly and the opposite ETF comes into play as a long.
Sell half shares on a spike up on any ETF you are long, even if goal is higher. Spikes higher are almost always followed by moves in the opposite direction. Try and get out with a market order quickly before the quick move back lower. Lock in that profit!