ETF Trading Research 12/28/2017
For those of you new here, I most of the time have the ETF Trading Research report out by 8PM PDT, and it comes by an RSS feed, but you can look at the report here sometimes before you get it in your mailbox; https://illusionsofwealth.com/category/etf-blogs/ This is also the same link if there are any technical difficulties.
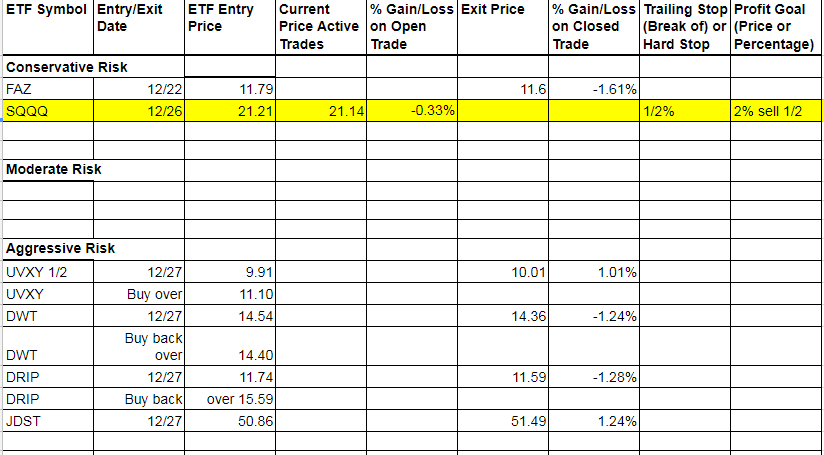
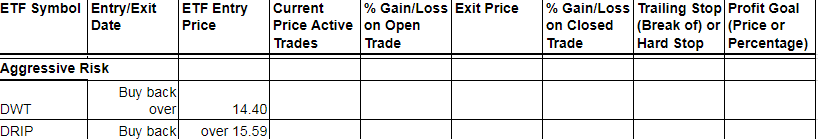
Today’s Trades and Current Positions (highlighted in yellow):
Light day of trading today. We got some whipsaw from the start but caught JDST quite well. You might have got lower and did better than below sa it moved lower by the time the alert came out. We got out just before the decline but JDST still came out on top today. FAS triggered green with the whipsaw and FAZ we stopped out with a smaller stop than the -2% normal stop out. SQQQ hanging in there. Tech should lead us lower if we are going to turn, but it might be next year. UVXY got us a little love and we still want to buy the dips in it and take some profit each time. Love to see a break of 9.77 tomorrow and buy some more. 20% to 30% is coming in it. Oil was a bust with the good data.
Economic Data For Tomorrow
No real data tomorrow.

http://www.investing.com/economic-calendar/

Today’s Hot Corner:
UGAZ, (FAS and UGAZ new green weekly and UGAZ green monthly too)
Cold Corner (the biggest move lower 3% or more that are green on the weekly and or weekly/monthly or turned red on the weekly – those in bold are consecutive days in the Cold Corner):
DGAZ, UVXY (no new red weekly’s)
Green Weekly’s
These are the ETFs that have turned green on the weekly and the dates they turned green. This is used for tracking your percentage gains so you know when to take profit for each ETF per the Trading Rules profit taking guidelines. These green weekly’s work as you can see from the %Gain/Loss tables. You won’t get the exact high with your trade but you will also be out typically well before they start to fall again or turn red on the weekly. Your best way to profit with the service is stick with the green weekly trend and take profit while using a trailing stop on remaining shares. Also, if these green ETFs are up for the day at the open, they offer the best scalping opportunities. I am always fine tuning this section so if there is confusion at all, email me and be specific and I’ll be happy address.
I know I have said this many times but it is worth repeating; If you stick with the green weekly trades your odds of profit increase as there is more risk with the day trades. I call the day trades with the intent of catching some runners, so will get a few 1% stop outs but eventually catch the 5% to 10% or more runners. The important part of the list below is that the longer the ETF stays on the list (the one’s at the top of the list by Entry Date) the more likely it is to turn red on the weekly and the opposite ETF comes into play as a long.
Sell half shares on a spike up on any ETF you are long, even if goal is higher. Spikes higher are almost always followed by moves in the opposite direction. Try and get out with a market order quickly before the quick move back lower. Lock in that profit!

