ETF Trading Research 1/1/2018
For those of you new here, I most of the time have the ETF Trading Research report out by 8PM PDT, and it comes by an RSS feed, but you can look at the report here sometimes before you get it in your mailbox; https://illusionsofwealth.com/category/etf-blogs/ This is also the same link if there are any technical difficulties.
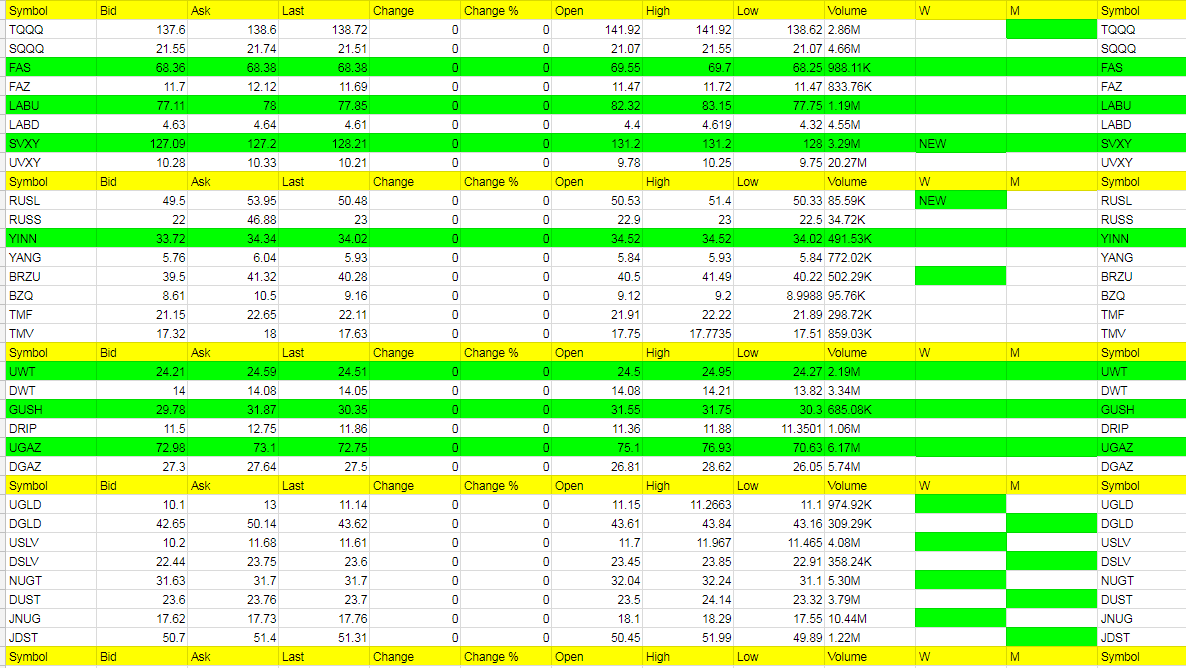
Today’s Trades and Current Positions (highlighted in yellow):
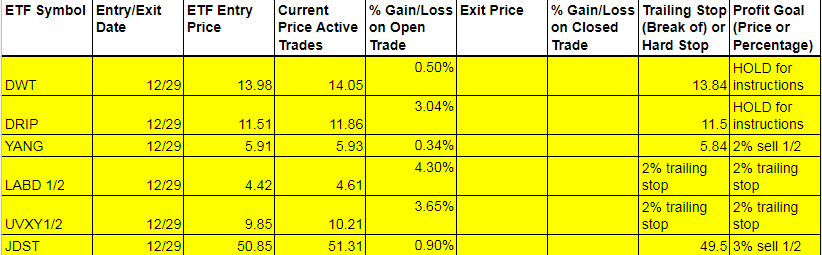
We started off a little slow and got stopped out of DWT by a penny, but then everything started to click by the end of day. Good way to end the year and if you took profit, that’s just fine. We’ll monitor all of these positions at the open and maybe take the quick profit on any that are up. We’ll see if market makers want to play hard ball at the beginning of the year or not. Like to see oil top and YANG take off here. Gold we’ll see what we can get and if we topped or now. LABD can run a bit. And UVXY while always volatile, can flip on a dime, so we have to be careful. Now that SVXY earlier in the day turned green on the weekly, we’ll have a good sign to get long or add to shares when it eventually turns red on the weekly. See what Monday brings for it as it ended the day negative.
Special Note: UGAZ and DGAZ are at their 3 day limits in the hot and cold corner. If UGAZ opens up positive and goes negative, DGAZ becomes a buy. If DGAZ opens up negative and goes positive or opens positive, either way, it is a buy. I have said this many times, but we rarely have any ETFs go 4 days straight in the hot and cold corner. Of course if you look at the weather over the weekend, it sure is/was cold.
Economic Data For Tomorrow
Manufacturing PMI after the open tomorrow.
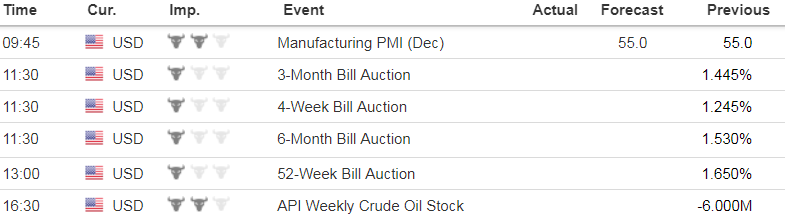
http://www.investing.com/economic-calendar/
Today’s Hot Corner:
LABD, UVXY, UGAZ
(SVXY and RUSL new green weekly)
Cold Corner (the biggest move lower 3% or more that are green on the weekly and or weekly/monthly or turned red on the weekly – those in bold are consecutive days in the Cold Corner):
LABU, DGAZ
(no new red weekly’s)
Green Weekly’s
These are the ETFs that have turned green on the weekly and the dates they turned green. This is used for tracking your percentage gains so you know when to take profit for each ETF per the Trading Rules profit taking guidelines. These green weekly’s work as you can see from the %Gain/Loss tables. You won’t get the exact high with your trade but you will also be out typically well before they start to fall again or turn red on the weekly. Your best way to profit with the service is stick with the green weekly trend and take profit while using a trailing stop on remaining shares. Also, if these green ETFs are up for the day at the open, they offer the best scalping opportunities. I am always fine tuning this section so if there is confusion at all, email me and be specific and I’ll be happy address.
I know I have said this many times but it is worth repeating; If you stick with the green weekly trades your odds of profit increase as there is more risk with the day trades. I call the day trades with the intent of catching some runners, so will get a few 1% stop outs but eventually catch the 5% to 10% or more runners. The important part of the list below is that the longer the ETF stays on the list (the one’s at the top of the list by Entry Date) the more likely it is to turn red on the weekly and the opposite ETF comes into play as a long.
Sell half shares on a spike up on any ETF you are long, even if goal is higher. Spikes higher are almost always followed by moves in the opposite direction. Try and get out with a market order quickly before the quick move back lower. Lock in that profit!