ETF Trading Research 7/30/2017
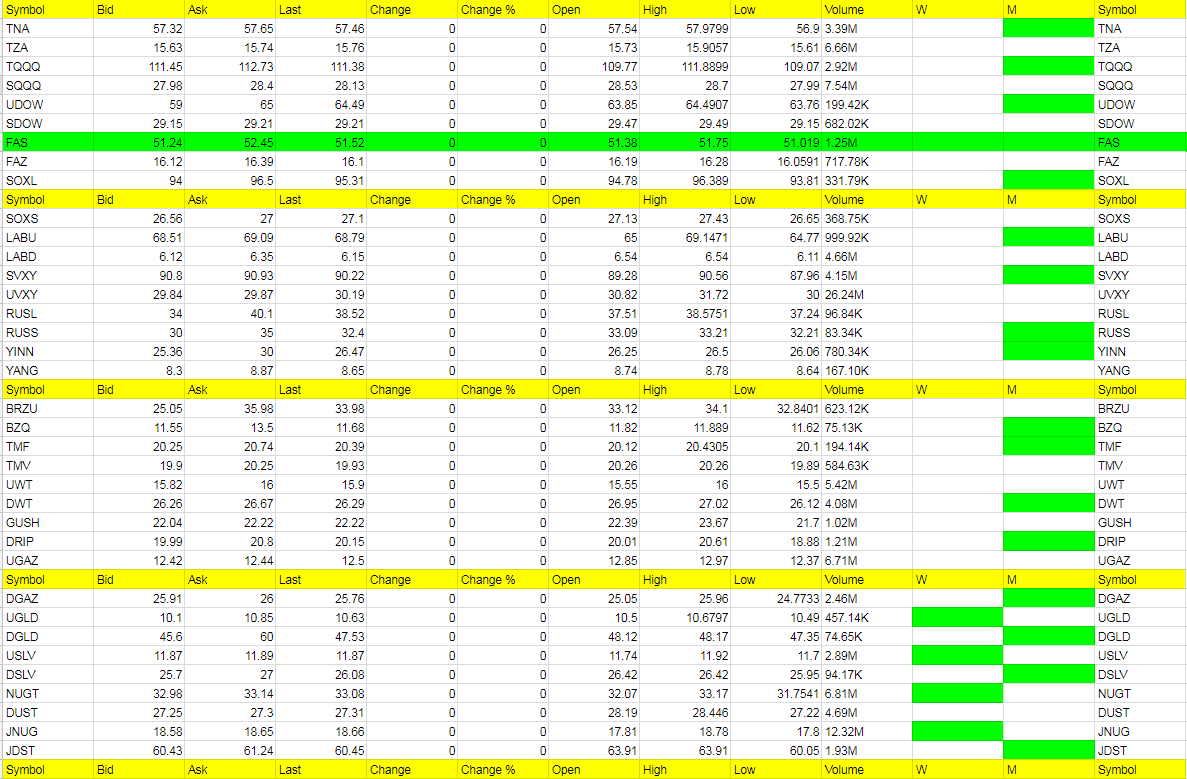
Today’s Trades and Current Positions (highlighted in yellow):
Economic Data For Tomorrow
Chicago PMI and the important Pending Home Sales tomorrow, all during market hours.

http://www.investing.com/economic-calendar/
Energy
Oil some say couldn’t hit 50. Well, it did overnight and that might be the top for now. 48.80 +0.09 presently. Any move below 49.50 should confirm.
Nat Gas is down in Asian trading and we’re just not off to the races yet with it. I wanted to see a break of 2.80 come and we are at 2.886 right now. DGAZ would be a better potential with this weakness but either way I would look to cost average into UGAZ here at some point. The call is to be neutral with all this back and forth but as we bottom in Nat Gas, start the march up past 3.10 to even 3.50, a huge run for UGAZ once we bottom.
Precious Metals and Mining Stocks
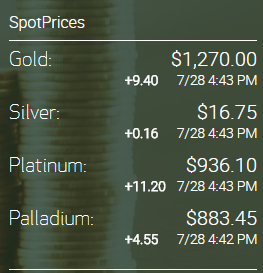
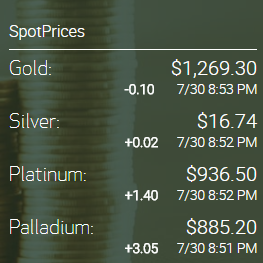
Gold is still struggling with that 1270-1272 level I mentioned in Thursday nights report and we’ll see if we can break through that now or have a slight pullback. While we are long gold and silver at present, miners we are out of except for Swing Traders and I gave us a 60% chance of being higher on Monday. We’ll see what the open brings and if we should get long again quickly or not. Any dips are 100% buys at this point. I took a snapshot of the lat Friday session and opening Asian prices for gold and they are similar. The dollar is up 6 cents to 93.26. USD/JPY though falling down -0.20 to 110.49. The more it falls the better miners should do.
COT report had banks cutting their longs but Funds have joined the long parade and banks and funds are long now. Producers though are still short and close to record high. Something has to give there. Same setup for silver now too. With Friday’s little bounce in metals banks are more than likely even more long now. This is all bullish for metals. 23 for GDX and 33.70 for GDXJ are still resistance levels and need to get through them and we can take off. Be long there no matter what in JNUG and everything else gold/silver related.
Hot Corner (the biggest movers – 3% or more – or new ETFs that are green on the weekly – those in bold are consecutive days in the Hot Corner):
JNUG, NUGT, LABU, UWT (UWT 3 out of 4 days and almost 4 out of 4)
Cold Corner (the biggest moved lower 3% or more that are green on the weekly and or weekly/monthly or turned red on the weekly – those in bold are consecutive days in the Cold Corner):
JDST, DUST, LABD, DWT
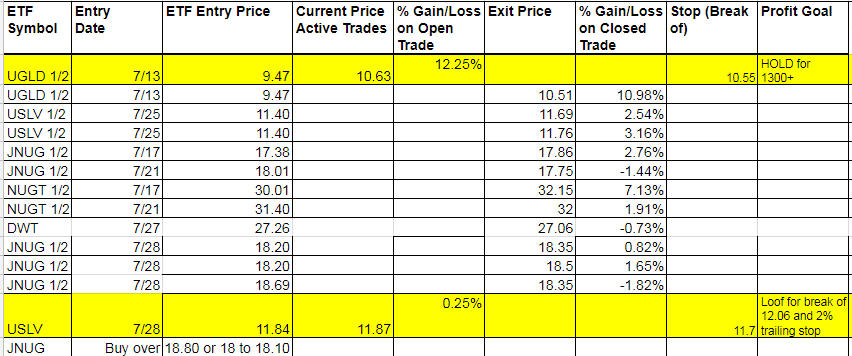
Green Weekly’s
These are the ETFs that have turned green on the weekly and the dates they turned green. This is used for tracking your percentage gains so you know when to take profit for each ETF per the Trading Rules profit taking guidelines. These green weekly’s work as you can see from the %Gain/Loss tables. You won’t get the exact high with your trade but you will also be out typically well before they start to fall again or turn red on the weekly. Your best way to profit with the service is stick with the green weekly trend and take profit while using a trailing stop on remaining shares. Also, if these green ETFs are up for the day at the open, they offer the best scalping opportunities. I am always fine tuning this section so if there is confusion at all, email me and be specific and I’ll be happy address.
I know I have said this many times but it is worth repeating; If you stick with the green weekly trades your odds of profit increase as there is more risk with the day trades. I call the day trades with the intent of catching some runners, so will get a few 1% stop outs but eventually catch the 5% to 10% or more runners. The important part of the list below is that the longer the ETF stays on the list (the one’s at the top of the list by Entry Date) the more likely it is to turn red on the weekly and the opposite ETF comes into play as a long.