ETF Trading Research 5/17/2017
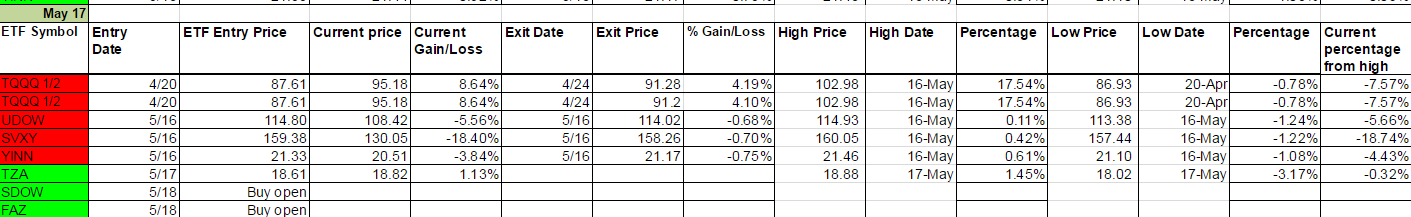
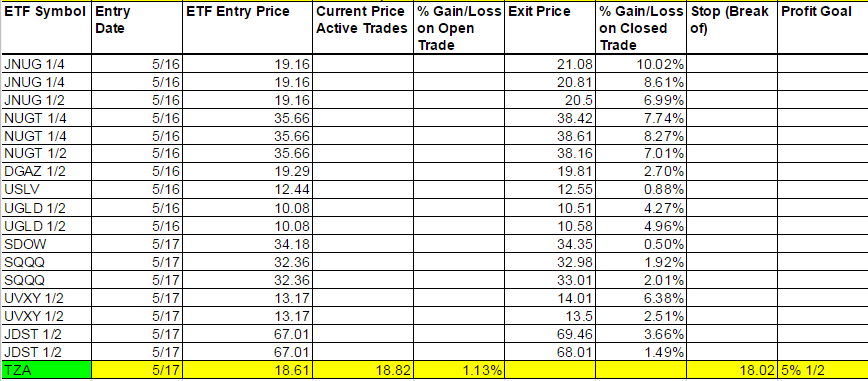
Current Positions and Today’s Trades (One’s highlighted in yellow we are still long)
Great day. Not much to say but I do go into good details below so make sure you read everything tonight. Thanks for all the great feedback today.
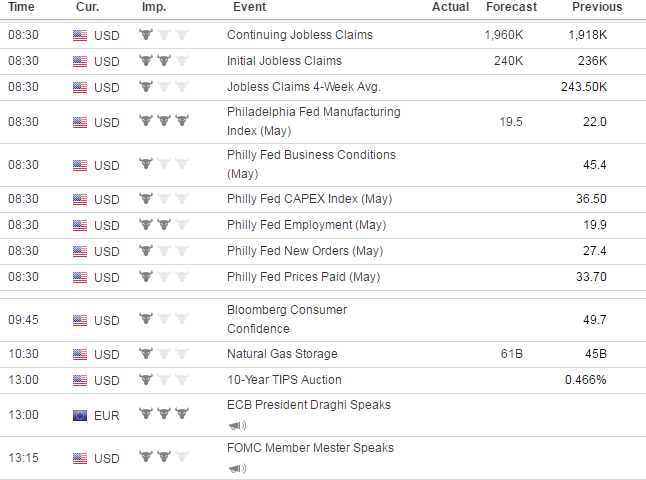
Economic Data For Tomorrow
Philly Fed and Initial Jobless Claims tomorrow. Nat Gas Storage at 10:30. ECB President Draghi speaking and one Fed member in the afternoon. God help the market if we get bad data.
It is more and more difficult for me to go against the new green weekly’s as I know they can be very powerful. But today I did just because I thought I saw some weakness. It seemed like all day the market wanted to move lower and for that matter gold higher but there were forces at work that wouldn’t let those two things happen. What those forces are I couldn’t tell you, but the fact is the dollar is heading lower and now it looks like the USD/JPY is heading lower also. This should hurt the market and help metals. Also, UVXY may take over for the daily trade instead of SVXY, but let’s not jump the gun here.
I did ignore the Foreign markets today as there are no green weekly’s and I didn’t see any pop up over 3%. We should keep an eye on BZQ, YANG (YINN just turned red on weekly) and RUSS though. All 3 should follow the U.S. lower. And also, I think YANG is overdue for a bigger pop.
Interest Rates
TMF is back to a buy I think. The more we tank the more money will run to treasuries. Lots of it.
Energy
Switching gears to UGAZ now from DGAZ. Keep an eye on it tomorrow. No trades till after the storage data tomorrow please.
Oil data came in worse than expected from what I saw but UWT shot up higher. Glad it was’t the only thing we were watching today or it might have got us into trouble. We might have to lean towards DWT at this point but let the market price tell us tomorrow what to do.
Precious Metals and Mining Stocks
Yesterday I said; “Still need some weakness in the overall markets and if we get that gold should have a good ride up for us.” We got what we wanted today and profited. Now we need to catch our breath I think. I don’t like putting trades on the last 1.5 hours of the day and I didn’t want to get whipsawed out with another trade in JNUG. Gold and silver had pulled back but I did see that the USD/JPY started to fall again and JNUG/NUGT moved up. I do think we will be at lower lows in the next 48 hours so please be careful on longs here. From an insider perspective, no, the phone wasn’t ringing off the hook today for my gold sales business. Far from it. Many investors are still in the buy the dip mode but we haven’t had this big of a market smack down since September of 2016. That speaks volumes to me of how overpriced this market is and how if everyone wants out, the market can fall quickly. Is a 1987 type of event around the corner? We’ll have to wait for China to show some real weakness but we should be leery of such. Haven’t heard the term “circuit breakers” in a long time, but think we will sometime this year.
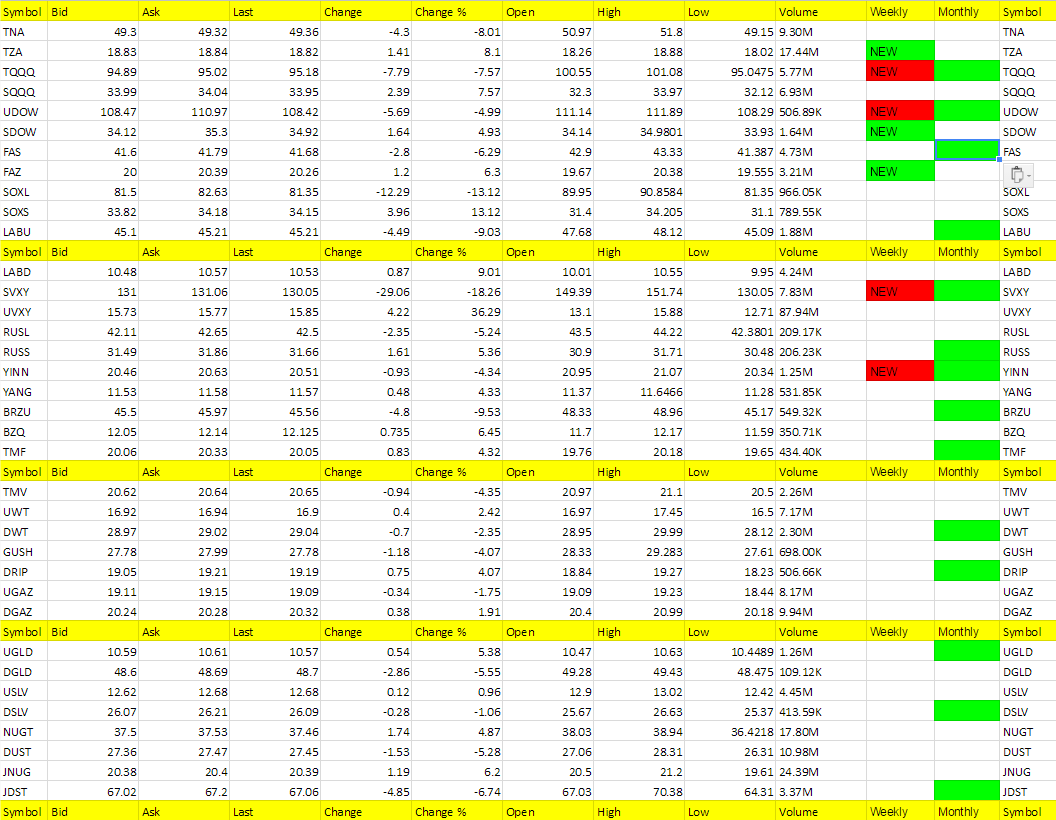
Hot Corner (the biggest movers – 3% or more – or new ETFs that are green on the weekly – those in bold are consecutive days in the Hot Corner):
UVXY, SOXS, LABD, TZA, SQQQ, FAZ, BZQ, JNUG, UGLD, SDOW, TMF, NUGT, RUSS, YANG, DRIP, (New green weekly’s for TZA, FAZ and SDOW).
Yesterday I said “Keep an eye on SOXS tomorrow if SOXL opens lower.” I hope you did as it was up 12.65% today.
Cold Corner (the biggest moved lower 3% or more that are green on the weekly and or weekly/monthly or turned red on the weekly – those in bold are consecutive days in the Cold Corner):
SVXY, SOXL, BRZU. LABU, TNA, TQQQ, FAS, JDST, DGLD, RUSL, UDOW, DUST, TMV, YINN, GUSH (TQQQ – finally, UDOW, SVXY and YINN turned red on the weekly today.
Green Weekly’s
These are the ETFs that have turned green on the weekly and the dates they turned green. This is used for tracking your percentage gains so you know when to take profit for each ETF per the Trading Rules profit taking guidelines. It is also used for tracking the percentage from high to keep a stop on remaining shares. These green weekly’s work as you can see from the %Gain/Loss tables. You won’t get the exact high with your trade but you will also be out before typically well before they start to fall again. Your best way to profit with the service is stick with the green weekly trend and take profit while using a trailing stop on remaining shares. Also, if these green ETFs are up for the day at the open, they offer the best scalping opportunities. I am always fine tuning this section so if there is confusion at all, email me and be specific and I’ll be happy address.
I know I have said this many times but it is worth repeating; If you stick with the green weekly trades your odds of profit increase as there is more risk with the day trades. I call the day trades with the intent of catching some runners, so will get a few 1% stop outs but eventually catch the 5% to 10% or more runners. The important part of the list below is that the longer the ETF stays on the list (the one’s at the top of the list by Entry Date) the more likely it is to turn red on the weekly and the opposite ETF comes into play as a long. You’ll notice in the last column on the right it says “Current percentage from high.” This is your normal stop out for any ETF where I don’t specifically call it per the Trading Rules which lists the trailing stops for each ETF. It is a Trailing Stop percentage from the high and I have noticed the pattern that the closer it gets to 5% the sooner the ETF turns red on the weekly.