ETF Trading Research 2/5/2018
For those of you new here, I most of the time have the ETF Trading Research report out by 8PM PDT, and it comes by an RSS feed, but you can look at the report here sometimes before you get it in your mailbox; https://illusionsofwealth.com/category/etf-blogs/ This is also the same link if there are any technical difficulties.
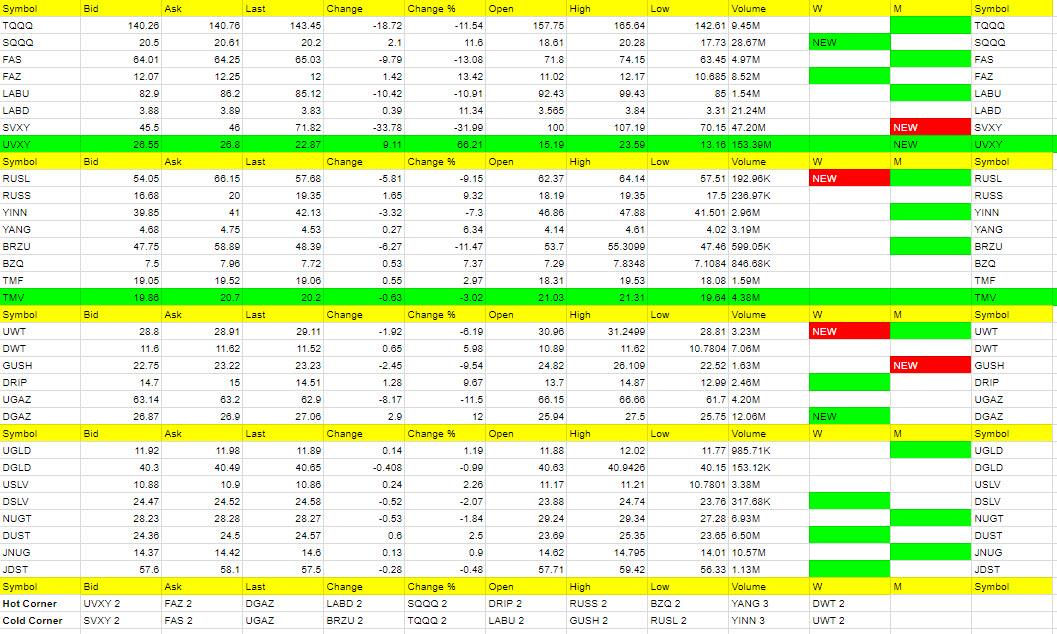
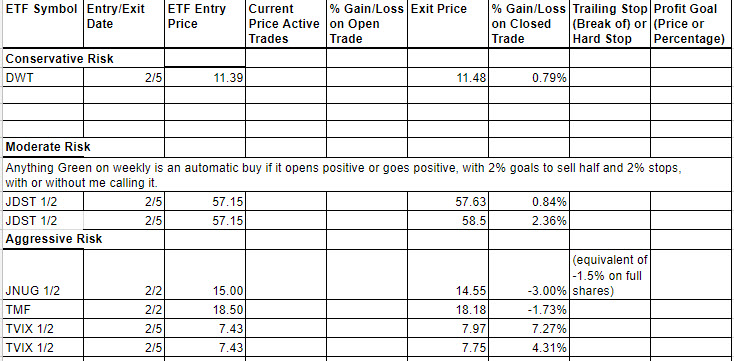
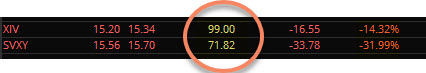
Today’s Trades and Current Positions (highlighted in yellow):
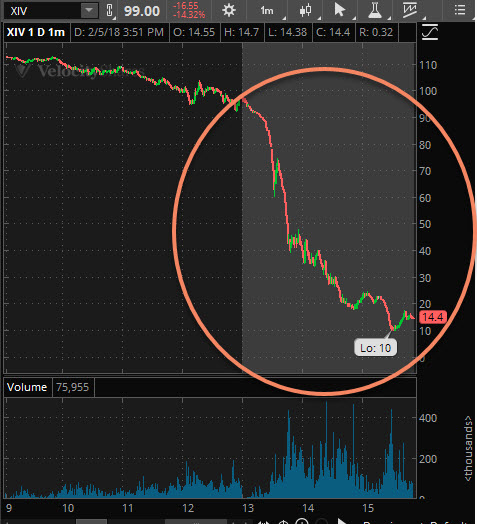
Could we have got more out of TVIX today? Sure. Was it the kind of day to have confidence in a trade? Only the green weekly’s that popped up like FAZ and SQQQ. We did get some profit from TVIX averaging over 5% which most wouldn’t complain about on a normal day. But this was no normal day. After hours, things got worse for XIV and SVXY as you’ll see below. Someone asked me when XIV was 39 if it made sense to trade even 1/4 shares and I said I wouldn’t. It fell to 10 and rose 80% from 10 and now is back down from there. Who knows where it will be tomorrow, but it may be de-listed. SVXY same boat. They would have to recover bigly tomorrow if they are going to stand a chance.
Economic Data For Tomorrow
I personally want to know what Bullard is going to say tomorrow. Other than that, JOLTs Job Openings and API.
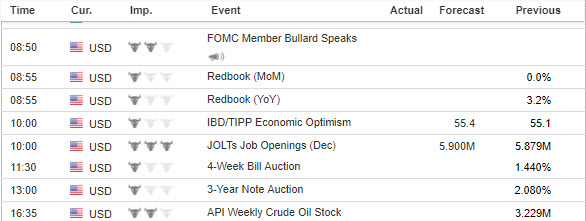
http://www.investing.com/economic-calendar/

These are the ETFs that have turned green on the weekly and show a trend has developed. Your best way to profit with the service is stick with the green weekly trend each day and take profit while using a trailing stops. Also, if these green ETFs are up for the day at the open, they offer the best scalping opportunities. I am always fine tuning this section so if there is confusion at all, email me and be specific and I’ll be happy address.
I know I have said this many times but it is worth repeating; If you stick with the green weekly trades your odds of profit increase as there is more risk with the day trades. I call the day trades with the intent of catching some runners, so will get a few 1% stop outs but eventually catch the 5% to 10% or more runners. The important part of the list below is that the longer the ETF stays on the list the more likely it is to turn red on the weekly and the opposite ETF comes into play as a long. This will be tracked more when we automate the service.
Sell half shares on a spike up on any ETF you are long, even if goal is higher. Spikes higher are almost always followed by moves in the opposite direction. Try and get out with a market order quickly before the quick move back lower. Lock in that profit!
New way to trade beaten down ETFs; The way that trade would work, and I really think it should be a rule from now on NOT to trade anything trending down until it reverses, is we would buy at the open if it is POSITIVE or GOES POSITIVE during the day. Then we would look to profit on 1/2 shares over and over, day after day until we get the red weekly signal on the opposite trade that could turn into bigger profits. The stop would be if it goes negative for the day. The rule of keeping a stop if it goes negative for the day is a must. Lastly for this type of trading we need to not be afraid to get back in if it goes positive once again. Sometimes market makers will take an ETF negative and then reverse it right higher again because they know if it goes negative many exit. So we have to be willing to risk a few in and outs when it does this up and down move around that potential stop out area so we don’t miss the ride back up. That’s just part of trading and not a big deal. But no matter what, if it breaks to yet another lower low because you didn’t get out after giving it a little more wiggle room, you are more than likely further from the original stop out when it went negative and you are out, waiting for it to go positive again before you get back in. You are simply buying into strength.