ETF Trading Research 7/20/2017
Today’s Trades and Current Positions (highlighted in yellow):
Today I didn’t want to over trade by making calls that were forced. The market just wasn’t offering us much. They pushed oil up and then down. They pushed nat gas up and then down. They pushed markets up and then down and back up. Metals were lower early and moved up and back down. I think the line in the movie Goodfella’s comes to mind about the market today; forgetaboutit!
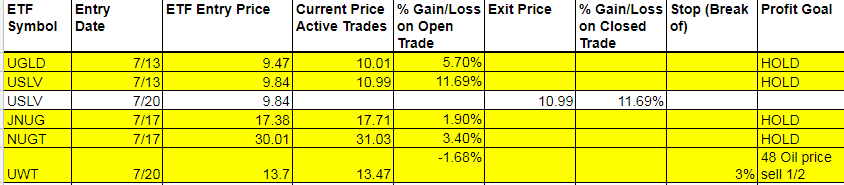
I decided to take the double digit profit in USLV of 11.56% on half shares. Just thinking we get a pullback here with no real follow through today in metals with the dollar down so much. Should have had more pop than we had.
Economic Data For Tomorrow
U.S. Baker Hughes Oil Rig Count is the only data out tomorrow at 1pm EDT.
http://www.investing.com/economic-calendar/
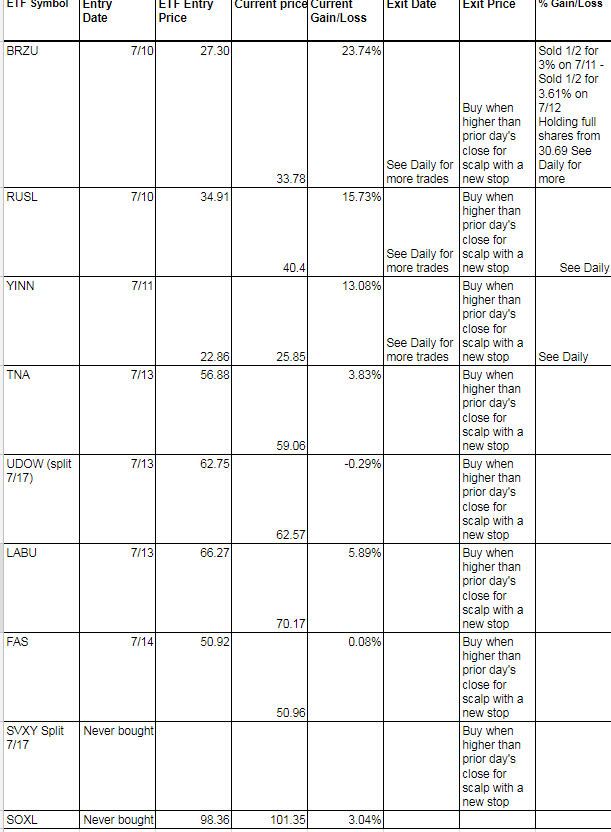
Mixed results today but BRZU stilll filling that gap on the chart.
Bonds have turned the corner and seem bullish now. I would expect TMF to turn green here at some point on the weekly.
Energy
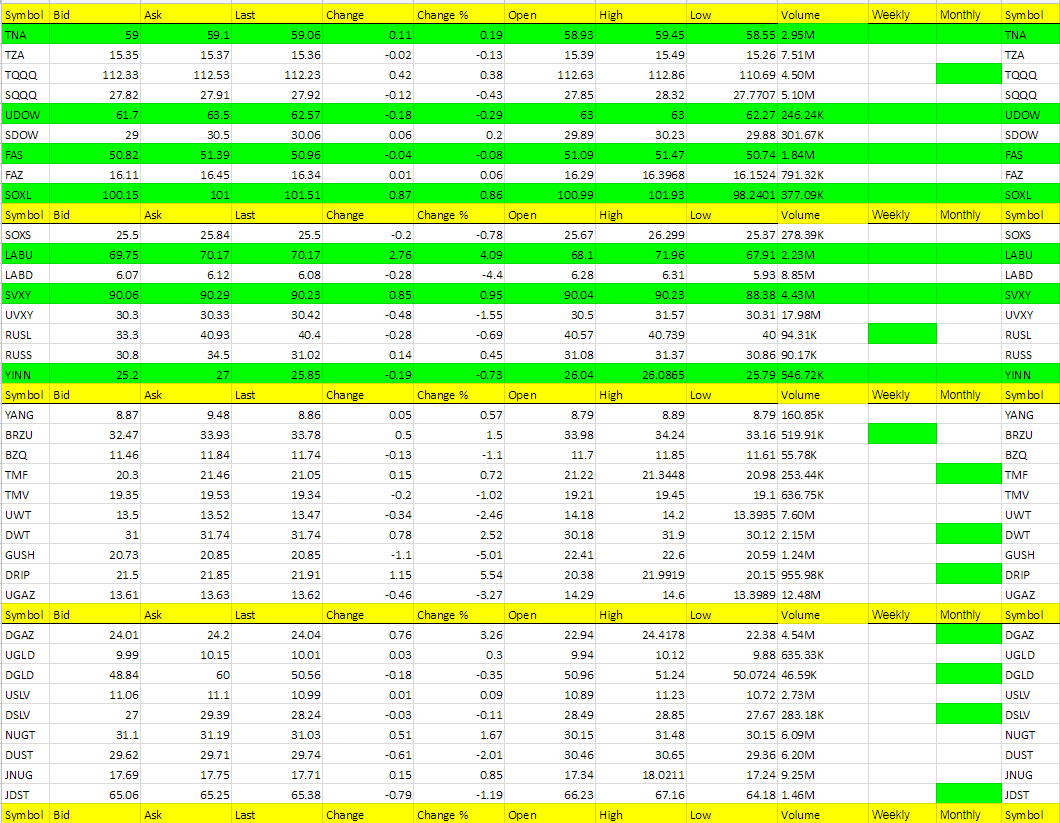
Nat Gas data came in bullish so what do the market makers do? They pushed DGAZ to an over 4% move in the positive.
Oil was doing fine in the morning and we were up 2%+ but then they pulled the rug from it. Not stopped out yet but now oil needs some good data tomorrow to give it a boost. I thought a weak dollar today would get it going, but so far, not the case.
Precious Metals and Mining Stocks
From the Trading Desk
The euro has been on a steady rise so far in 2017 and it reached yearly highs today on the heels of the European Central Bank press conference. ECB President Mario Draghi said the bank saw signs of “unquestionable improvement” in European Union growth and intimated that plans are underway for policymakers to begin adjusting their quantitative easing program. The euro rallied to over 1.16 and dragged gold back over $1,240 with it.
Gold hasn’t seemed to really react to any headline concerning President Trump but today it appeared to jump higher on the latest Trump headline. The news was that special counsel Robert Mueller is now focusing the attention of the Russia investigation on Trump’s business transactions. Gold made three week highs and challenged, yet failed, at the convergence of the 50 and 100 day moving averages around $1,248.50.
The latest data from the CFTC showed that speculative short positions on Comex silver are at 2 year highs. This information was as of last week when silver was under $16. If gold is able to break above its current range, hedge funds and money managers that are short silver will be forced to cover their positions which could lead to a volatile spike higher for the white metal.
Hot Corner (the biggest movers – 3% or more – or new ETFs that are green on the weekly – those in bold are consecutive days in the Hot Corner):
DRIP, LABU, DGAZ
Cold Corner (the biggest moved lower 3% or more that are green on the weekly and or weekly/monthly or turned red on the weekly – those in bold are consecutive days in the Cold Corner):
GUSH, LABD, UGAZ
Green Weekly’s
These are the ETFs that have turned green on the weekly and the dates they turned green. This is used for tracking your percentage gains so you know when to take profit for each ETF per the Trading Rules profit taking guidelines. These green weekly’s work as you can see from the %Gain/Loss tables. You won’t get the exact high with your trade but you will also be out typically well before they start to fall again or turn red on the weekly. Your best way to profit with the service is stick with the green weekly trend and take profit while using a trailing stop on remaining shares. Also, if these green ETFs are up for the day at the open, they offer the best scalping opportunities. I am always fine tuning this section so if there is confusion at all, email me and be specific and I’ll be happy address.
I know I have said this many times but it is worth repeating; If you stick with the green weekly trades your odds of profit increase as there is more risk with the day trades. I call the day trades with the intent of catching some runners, so will get a few 1% stop outs but eventually catch the 5% to 10% or more runners. The important part of the list below is that the longer the ETF stays on the list (the one’s at the top of the list by Entry Date) the more likely it is to turn red on the weekly and the opposite ETF comes into play as a long.