ETF Trading Research 5/11/2017
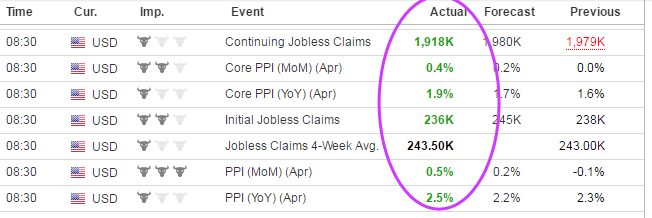
I got thrown for a loop this morning. Once the data came out it should have meant bullish for stock market and dollar and bearish for gold. Gold didn’t really fall and the market fell hard and miners shot up. I just didn’t trust it. Then when I was convinced I didn’t get the trade out quickly enough and we never fell back to my target buy. Just frustrating overall.
Here was the data. You tell me how the market fell with this? PPI especially.
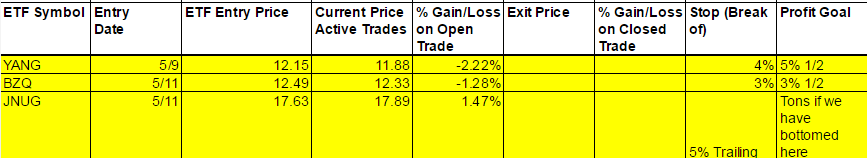
Current Positions
Economic Data For Tomorrow
Ton of data tomorrow starting at 8:30 with CPI and Retail Sales being the most important. Lots of stores have closed and it will be interesting if the data reflects the continuation of weaker demand for consumers to buy things.

You can see the big red candle below and what futures did in falling and then they got ramped right back up again.
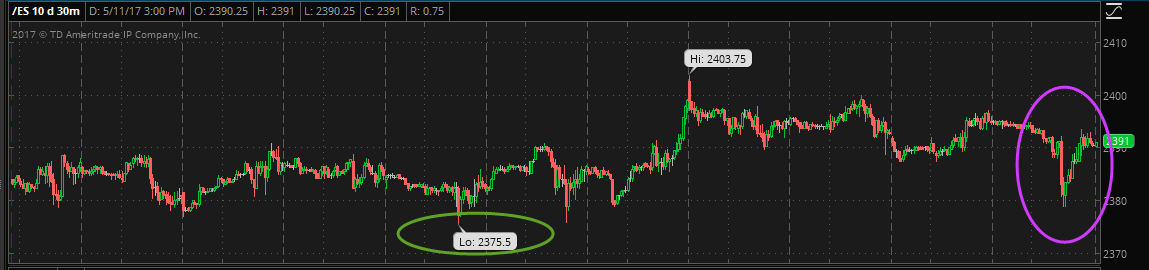
We will look for the break now of 2375.50 to start shorting the market more and a move over 2403.75 to confirm the bull. My guess is we are going long the short the market ETFs as I don’t expect a good retail number in the morning though.
Futures on a slight downward slope at present.

I have a new rule and this one might make us good money and I will input into our daily trading but it may take a bit for me to get used to it. Anytime SVXY is positive for the day, buy it. You can ride it up with a trailing stop for a scalp and go home flat each day. If it turned negative after opening positive, sell it. If I had this trade on since inception of this service, we would be up a on on it.
Foreign Markets
YANG did what it was supposed to do and we’ll look for continuation higher tomorrow. BZQ should bounce now as well.
Interest Rates
Flat on the day and no call but TMF is one I am considering for the Mutual Fund. Looks like a double bottom on the chart at 18.75 here.
Energy
The DGAZ trade failed again and now is on it’s 3rd day on the Cold Corner for 3% or more losses. I have never had one go 4 days in a row before.
Precious Metals and Mining Stocks
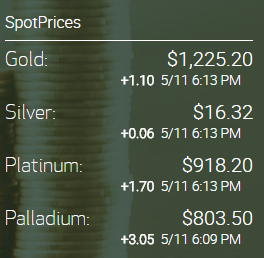
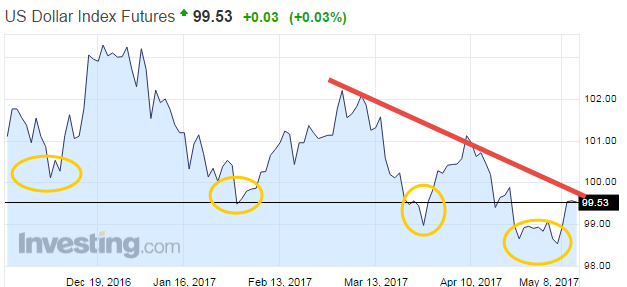
Gold we have over 1225 as I type and it looks like it is good to go higher. USLV and UGLD will be part of the mutual fund when I call it. Take a look at the gold chart and compare to where we are on the dollar below. Looking good for a long. 4 lower lows on the dollar going back to December 2016. There still might be a little wiggle room for one more move up in the dollar and down in gold but do think we are extremely close to that bottom. Would surprise me otherwise.

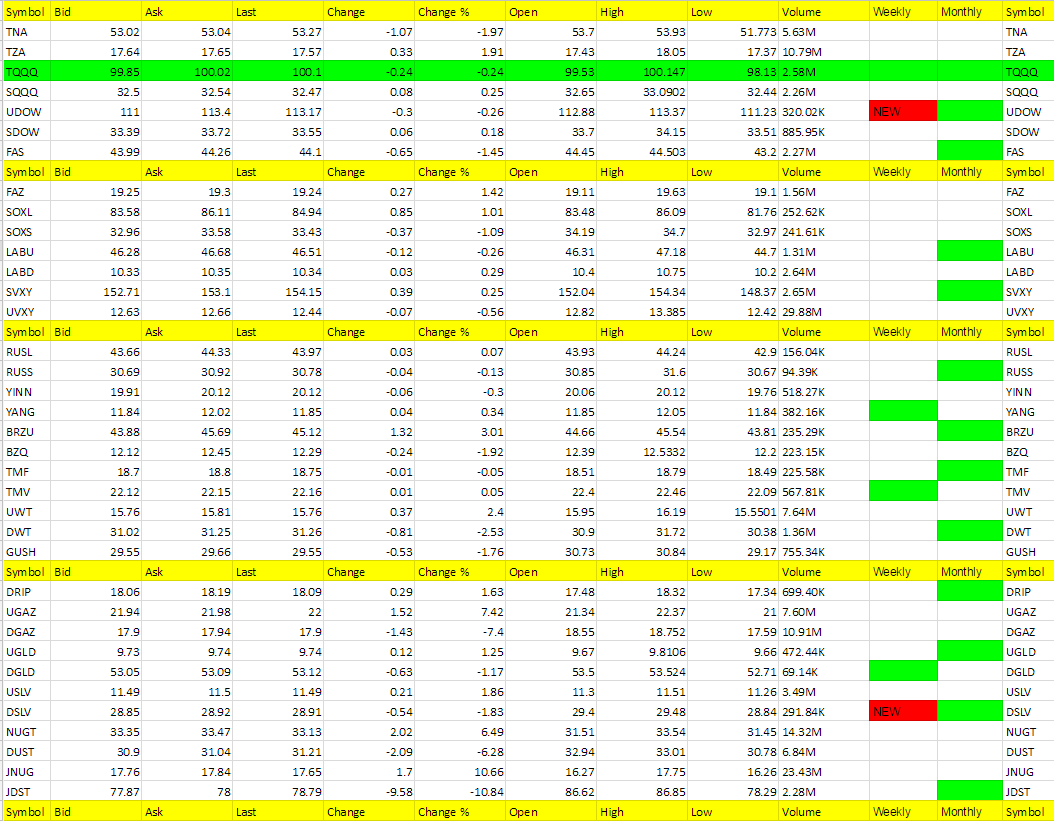
Hot Corner (the biggest movers – 3% or more – or new ETFs that are green on the weekly – those in bold are consecutive days in the Hot Corner):
JNUG, UGAZ, NUGT – Red means it is day 4 for UGAZ
Cold Corner (the biggest moved lower 3% or more that are green on the weekly and or weekly/monthly or turned red on the weekly – those in bold are consecutive days in the Cold Corner):
JDST, DGAZ, DUST – Red means it is day 4 for DGAZ (DSLV turned red on the weekly)
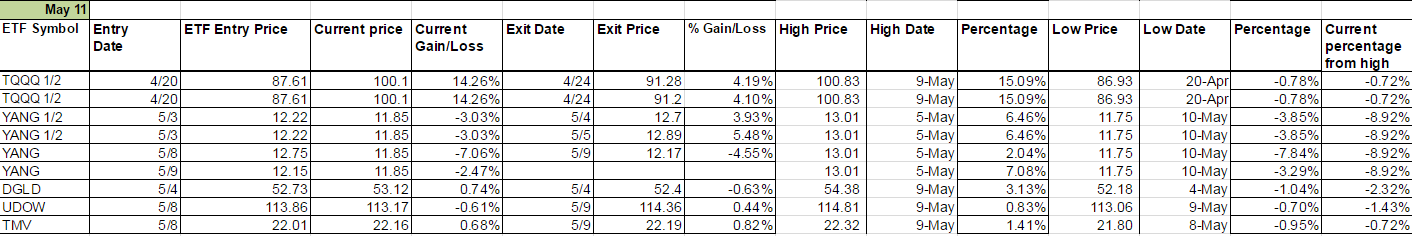
Green Weekly’s
These are the ETFs that have turned green on the weekly and the dates they turned green. This is used for tracking your percentage gains so you know when to take profit for each ETF per the Trading Rules profit taking guidelines. It is also used for tracking the percentage from high to keep a stop on remaining shares. These green weekly’s work as you can see from the %Gain/Loss tables. You won’t get the exact high with your trade but you will also be out before typically well before they start to fall again. Your best way to profit with the service is stick with the green weekly trend and take profit while using a trailing stop on remaining shares. Also, if these green ETFs are up for the day at the open, they offer the best scalping opportunities. I am always fine tuning this section so if there is confusion at all, email me and be specific and I’ll be happy address.
I know I have said this many times but it is worth repeating; If you stick with the green weekly trades your odds of profit increase as there is more risk with the day trades. I call the day trades with the intent of catching some runners, so will get a few 1% stop outs but eventually catch the 5% to 10% or more runners. The important part of the list below is that the longer the ETF stays on the list (the one’s at the top of the list by Entry Date) the more likely it is to turn red on the weekly and the opposite ETF comes into play as a long. You’ll notice in the last column on the right it says “Current percentage from high.” This is your normal stop out for any ETF where I don’t specifically call it per the Trading Rules which lists the trailing stops for each ETF. It is a Trailing Stop percentage from the high and I have noticed the pattern that the closer it gets to 5% the sooner the ETF turns red on the weekly.