ETF Trading Research 5/22/2017
Current Positions and Today’s Trades
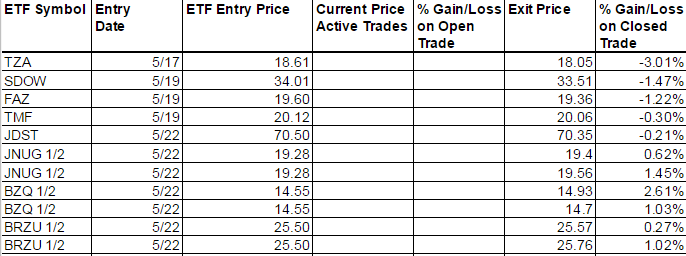
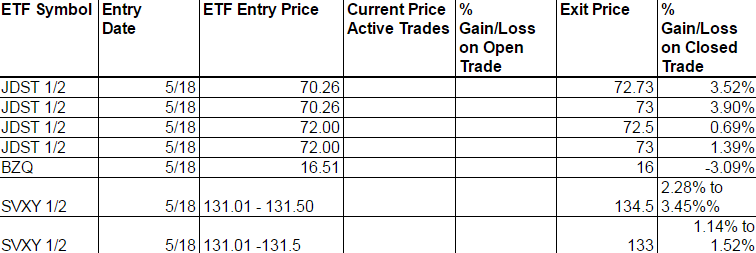
The following shows the closed out green trades that didn’t pan out, as I said the -300 day on Thursday ended up being a one off event. Chalk that up to big day moves that can tweak the trend. I gave the example of BZQ and why we didn’t get long on Monday as it fell -16%, but we did trade it long today for some profit. Got some profit though from JNUG and BRZU as well.
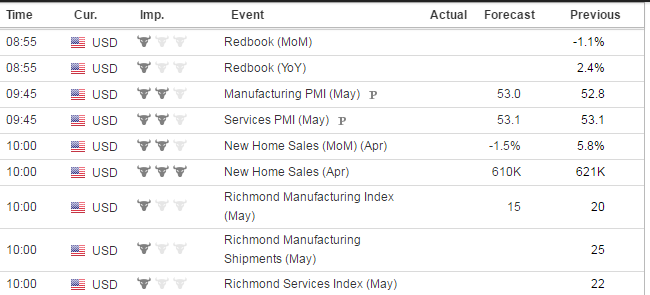
New Home Sales is the big data number for tomorrow. Luckily it comes out during market hours and should set up a trade for us.
Traded both BZQ and BRZU today for profit. YINN will be the one to buy at the open tomorrow.
Interest Rates
It seems every time we try and get a run in TMF it reverses. This, along with TLT before when we traded it, have only been good for scalps thus far.
Energy
Still looking for a little higher in UGAZ before we get long DGAZ. See if we get the right setup.
Crude oil opened higher today but there was no follow through. We will keep a closer eye on UWT and DWT tomorrow.
Precious Metals and Mining Stocks
Silver is acting stronger than gold and we have to look at it closely tomorrow. We got a bounce off the lows for the dollar and have to see if their is any continuation tomorrow or if JDST has one more leg in it. Should have our answers soon and some better profit coming.
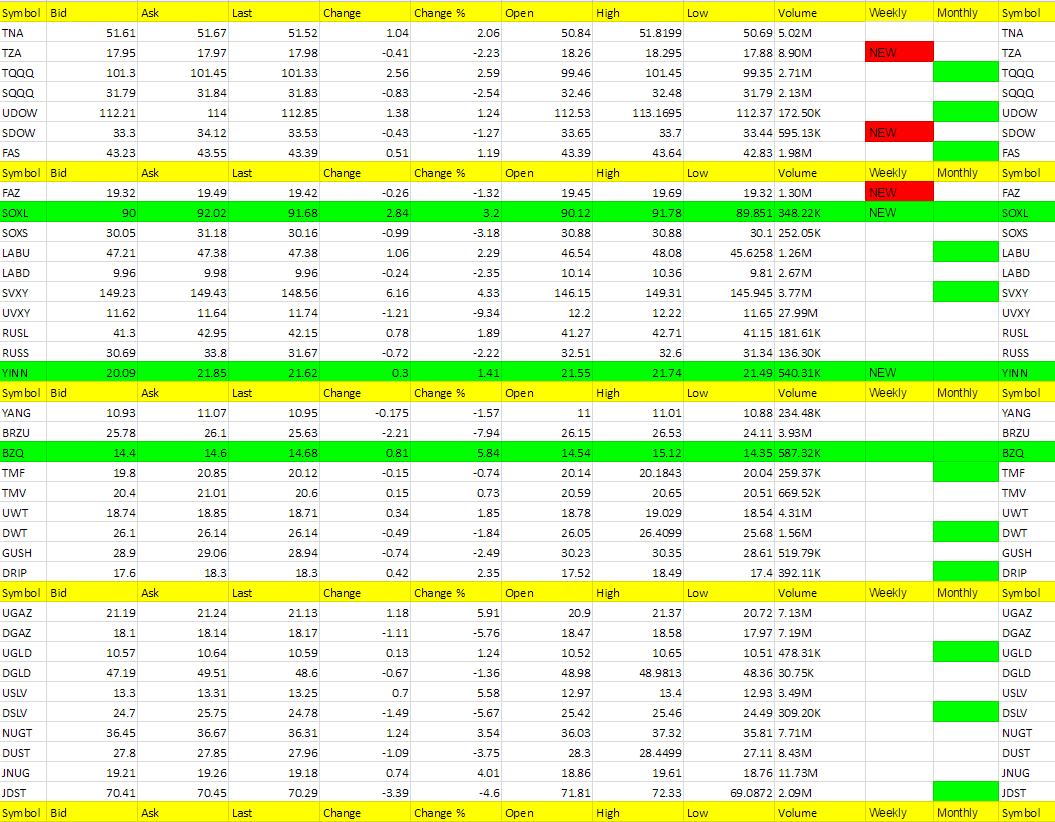
Hot Corner (the biggest movers – 3% or more – or new ETFs that are green on the weekly – those in bold are consecutive days in the Hot Corner):
UGAZ, BZQ, USLV, SVXY, JNUG, NUGT, SOXL (YINN and SOXL new green weekly’s)
Cold Corner (the biggest moved lower 3% or more that are green on the weekly and or weekly/monthly or turned red on the weekly – those in bold are consecutive days in the Cold Corner):
UVXY, BRZU, DGAZ, DSLV, JDST, DUST, SOXS (TZA, SDOW, FAZ new red weekly).
UVXY, BZQ, DRIP, DWT, DGAZ, DSLV, LABU, DUST, SOXS, YANG
Green Weekly’s
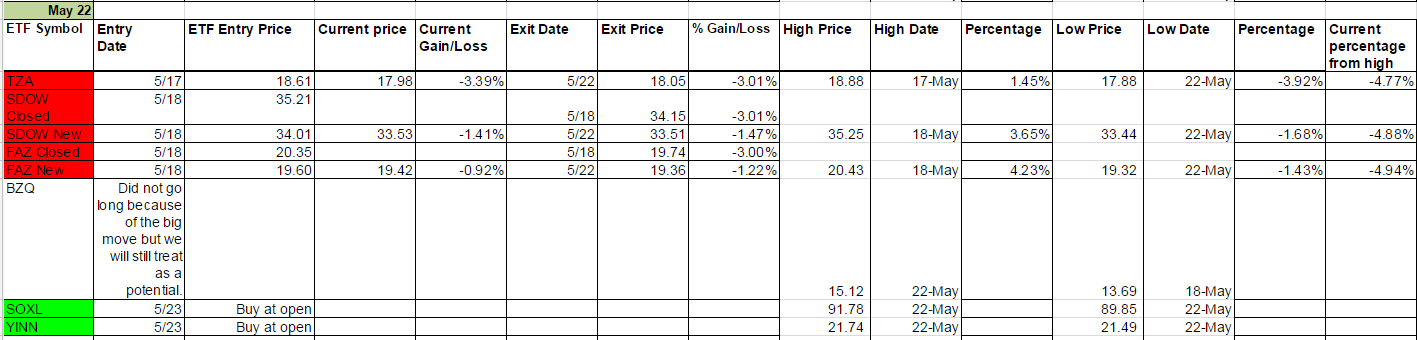
These are the ETFs that have turned green on the weekly and the dates they turned green. This is used for tracking your percentage gains so you know when to take profit for each ETF per the Trading Rules profit taking guidelines. It is also used for tracking the percentage from high to keep a stop on remaining shares. These green weekly’s work as you can see from the %Gain/Loss tables. You won’t get the exact high with your trade but you will also be out before typically well before they start to fall again. Your best way to profit with the service is stick with the green weekly trend and take profit while using a trailing stop on remaining shares. Also, if these green ETFs are up for the day at the open, they offer the best scalping opportunities. I am always fine tuning this section so if there is confusion at all, email me and be specific and I’ll be happy address.
I know I have said this many times but it is worth repeating; If you stick with the green weekly trades your odds of profit increase as there is more risk with the day trades. I call the day trades with the intent of catching some runners, so will get a few 1% stop outs but eventually catch the 5% to 10% or more runners. The important part of the list below is that the longer the ETF stays on the list (the one’s at the top of the list by Entry Date) the more likely it is to turn red on the weekly and the opposite ETF comes into play as a long. You’ll notice in the last column on the right it says “Current percentage from high.” This is your normal stop out for any ETF where I don’t specifically call it per the Trading Rules which lists the trailing stops for each ETF. It is a Trailing Stop percentage from the high and I have noticed the pattern that the closer it gets to 5% the sooner the ETF turns red on the weekly.
