ETF Trading Research 5/3/2017
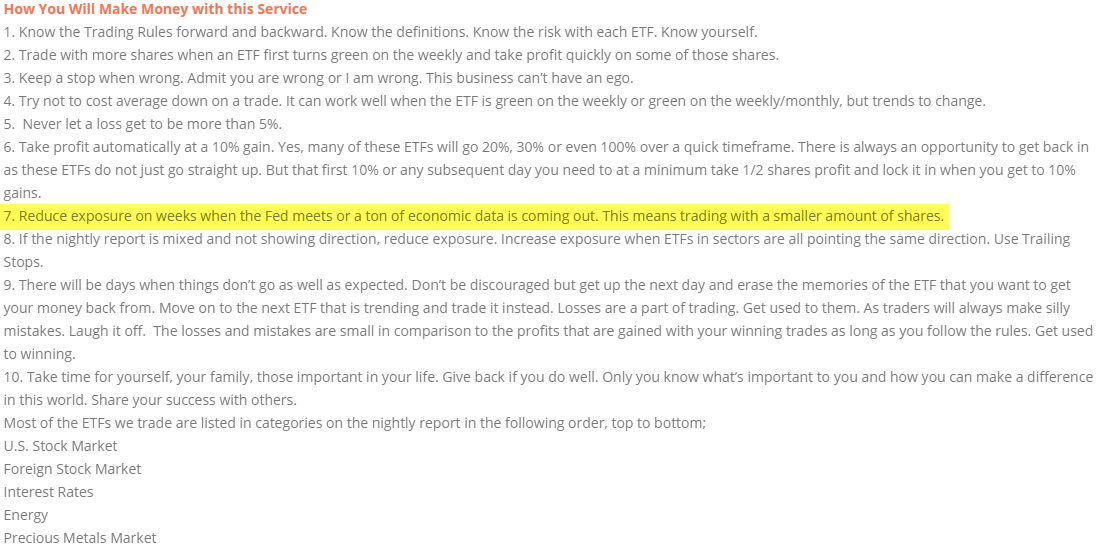
I want to remind you of a section in the Trading Rules, which I am going to revamp by Sunday, what it says under “How You Will Make Money with this Service. I create these as a guideline but #7 stands out this week as one that might have been ignored since it is Fed week.
Today’s Trades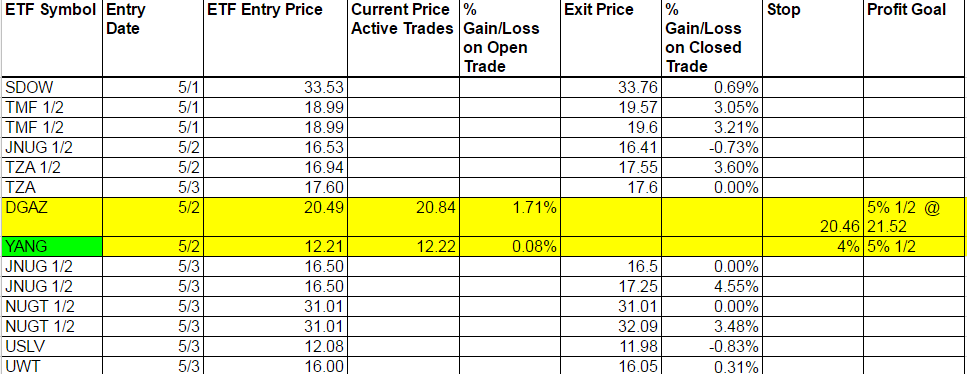
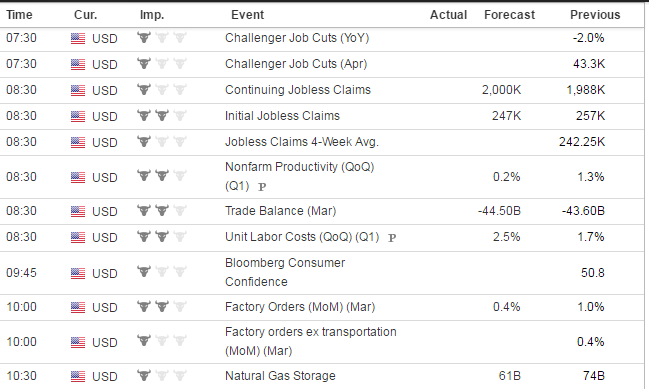
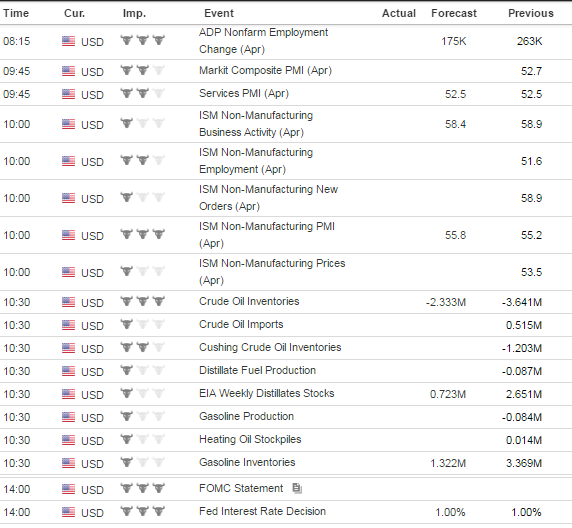
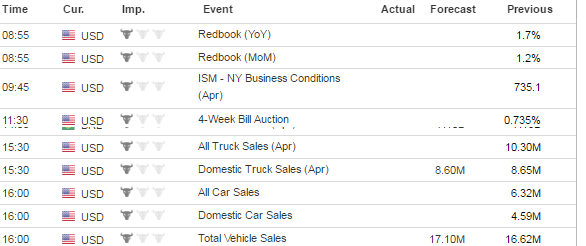
Economic Data For Tomorrow
Important data tomorrow is Initial Jobless Claims at 8:30 EDT. It is a lower number than last week. We also have Natural Gas Storage and if we are up on DGAZ a decent amount before storage, we might take profit on at least half shares.
Stock Market
The data that came out was all positive today and I used that as an opportunity to get out of the short the market ETFs we were in. The market then took a dive lower but bounced right back up pre-Fed. How is it every time the market goes lower it bounces back up? After the Fed announcement the market tried to go a little higher but there was nothing worth trading long. Might not have any action until Friday’s Unemployment number.
Foreign Markets
YANG is flat and RUSS we have to possibly go long tomorrow if it opens positive. A negative U.S. market might help it as well. Be open to it as I did mention it yesterday.
Interest Rates
TMF was a disappointment after the Fed today, but we did profit from it. We will keep an eye on it.
Energy
Data was bad for oil ruining our chance at good profit with UWT. We took a stab at UWT but got out flat.
Precious Mtals and Mining Stocks
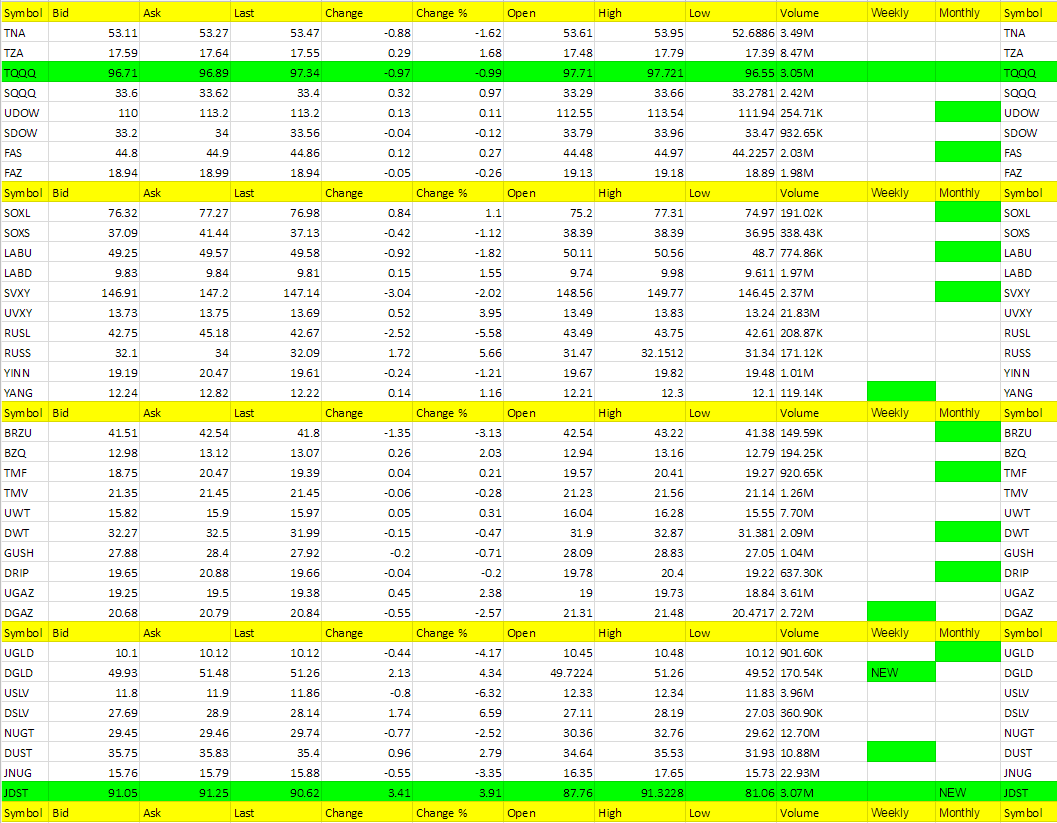
The data came out strong today and ruined any chance of a profit in JNUG early on, then we let the market settle down and pre-Fed got long for a scalp in JNUG or NUGT. Some of you took that profit and others did not, but then JNUG continued lower. I was up in the middle of the night specifically writing to those of you who hold onto these ETFs too long, trying to explain to you that if you sold you could take part in other green weekly’s that might at least get you back some of the losses. Losses are a part of trading. Big losses are the death of trading and more. I think you can get big losses back if you stick with only trading green weekly ETFs and using the rules set below in the 2 paragraphs that are there every day for you.Hot Corner (the biggest movers – 3% or more – or new ETFs that are green on the weekly – those in bold are consecutive days in the Hot Corner):
DSLV, RUSS, JDST, DGLX, UVXY (DGLX new green weekly and JDST new green monthly)
Cold Corner (the biggest moved lower 3% or more that are green on the weekly and or weekly/monthly or turned red on the weekly – those in bold are consecutive days in the Cold Corner):
USLV, RUSL,UGLD, JNUG
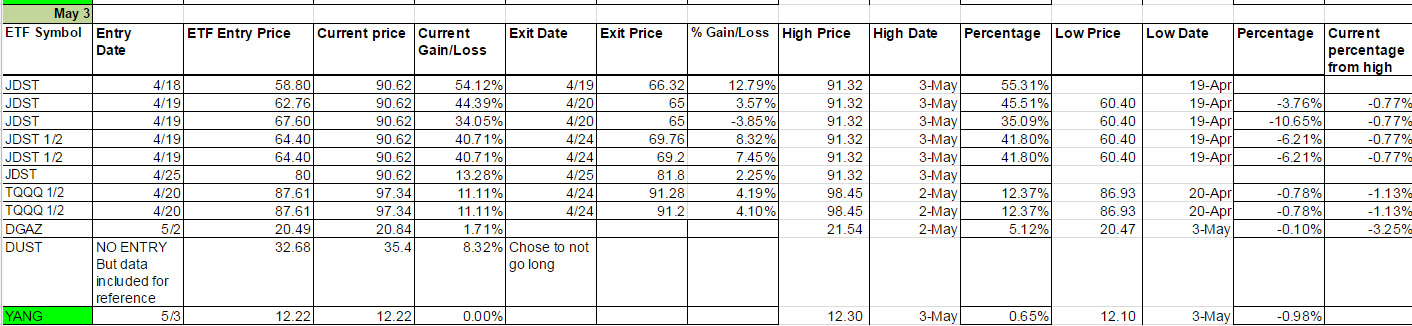
Green Weekly’s
These are the ETFs that have turned green on the weekly and the dates they turned green. This is used for tracking your percentage gains so you know when to take profit for each ETF per the Trading Rules profit taking guidelines. It is also used for tracking the percentage from high to keep a stop on remaining shares. These green weekly’s work as you can see from the %Gain/Loss tables. You won’t get the exact high with your trade but you will also be out before typically well before they start to fall again. Your best way to profit with the service is stick with the green weekly trend and take profit while using a trailing stop on remaining shares. Also, if these green ETFs are up for the day at the open, they offer the best scalping opportunities too. I am always fine tuning this section so if there is confusion at all, email me and be specific and I’ll be happy address.
I know I have said this many times but it is worth repeating; If you stick with the green weekly trades your odds of profit increase as there is more risk with the day trades. I call the day trades with the intent of catching some runners, so will get a few 1% stop outs but eventually catch the 5% to 10% or more runners. The important part of the list below is that the longer the ETF stays on the list (the one’s at the top of the list by Entry Date) the more likely it is to turn red on the weekly and the opposite ETF comes into play as a long. You’ll notice in the last column on the right it says “Current percentage from high.” This is your normal stop out for any ETF where I don’t specifically call it per the Trading Rules which lists the trailing stops for each ETF. It is a Trailing Stop percentage from the high and I have noticed the pattern that the closer it gets to 5% the sooner the ETF turns red on the weekly.
